Sun.Jan 21, 2024

article thumbnail

Quiz of the Day (Excel) #15

Analytics Vidhya

Welcome to the AI Quiz on Excel! In this exciting exploration of artificial intelligence (AI) in spreadsheet software, we will explore the fascinating intersection of technology and data manipulation. As Excel continues to evolve, integrating AI features has become a game-changer, revolutionizing how we analyze, visualize, and interpret information.

article thumbnail

It’s Not Magic if it is Producing Real Global Benefits and Business Value

Rocket-Powered Data Science

Source: [link] When I was young, my dad told me about an incident that he experienced at work. He was a US Air Force officer. On that particular day, there was an unannounced (surprise) drill – a simulated national defense emergency. Though it was just a drill, it was still important to get it done right and efficiently. One of his responsibilities was to contact certain high-ranking officers and communicate with them about the situation (in this case, the simulated emergency).

IT 183
Insiders

Sign Up for our Newsletter

This site is protected by reCAPTCHA and the Google Privacy Policy and Terms of Service apply.

article thumbnail

Indentation in Python with Examples

Analytics Vidhya

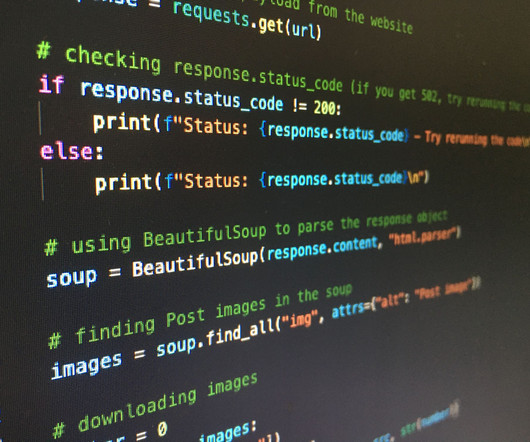
Introduction Indentation plays a crucial role in Python programming. It is a unique feature of the language that sets it apart from other programming languages. In Python, indentation is used to define the structure and hierarchy of the code. It helps in visually organizing the code and making it more readable. This article will explore […] The post Indentation in Python with Examples appeared first on Analytics Vidhya.

article thumbnail

Chart Snapshot: Anchor Chart + Example

The Data Visualisation Catalogue

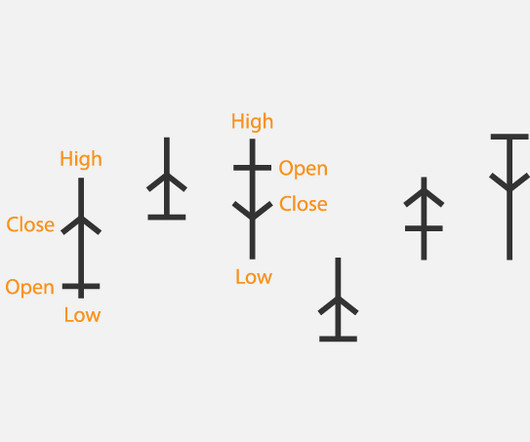
This chart was originally used as a trading tool to visualise and analyse the price movements over time. Each symbol or ‘anchor’ represents a trading session. The vertical line through the middle represents the highest price from the top (or starting) position, while the bottom (or end) represents the lowest price. The short, horizontal line marker indicates the open price, while the arrowhead marks the close price.

article thumbnail

Optimizing The Modern Developer Experience with Coder

Many software teams have migrated their testing and production workloads to the cloud, yet development environments often remain tied to outdated local setups, limiting efficiency and growth. This is where Coder comes in. In our 101 Coder webinar, you’ll explore how cloud-based development environments can unlock new levels of productivity. Discover how to transition from local setups to a secure, cloud-powered ecosystem with ease.

article thumbnail

Enhancing Python Code: The Power of Effective Comments

Analytics Vidhya

Introduction When it comes to writing code in Python, it’s not just about creating functional and efficient programs. It’s also about making your code readable, maintainable, and collaborative. One way to achieve this is by writing comments in your Python code. Comments are lines of text that the Python interpreter ignores but provide valuable information […] The post Enhancing Python Code: The Power of Effective Comments appeared first on Analytics Vidhya.

Analytics 306
article thumbnail

Replace Battery in the Ecobee Sensor

Data Science 101

The battery in the Ecobee sensor is quite easy to replace, you just need to get the correct replacement battery. The size of the battery is CR2477. To Purchase the batteries on Amazon EEMB CR2477 Batteries, 5 Pack Replacement Ecobee Sensor As an Amazon Associate I earn from qualifying purchases.

45

More Trending

article thumbnail

How to Convert Python Dictionary to Pandas DataFrame ?

Analytics Vidhya

Introduction Python is a versatile programming language that offers a wide range of data structures to work with. Two popular data structures in Python are dictionaries and pandas DataFrames. In this article, we will explore the process of converting a Python dictionary into a pandas DataFrame. Learn Introduction to Python Programming. Click here. What is a […] The post How to Convert Python Dictionary to Pandas DataFrame ?

Analytics 303
article thumbnail

Image Resizing using OpenCV in Python

Analytics Vidhya

Introduction Image resizing is a crucial task in computer vision that involves changing the dimensions of an image while maintaining its aspect ratio. It is fundamental in various applications, including web development, computer vision tasks, and machine learning models. In this article, we will explore different image-resizing techniques using OpenCV, a popular library for computer […] The post Image Resizing using OpenCV in Python appeared first on Analytics Vidhya.