Sun.Jun 30, 2024

article thumbnail

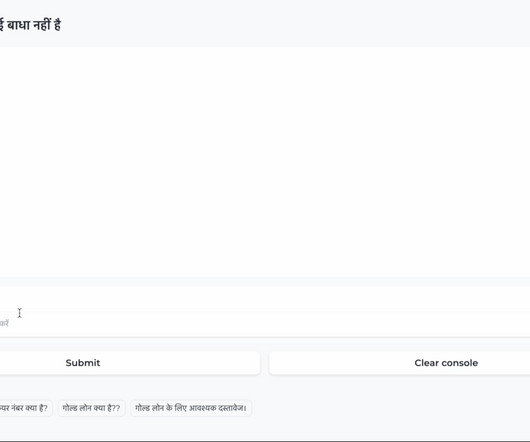
How to Build a Multilingual Chatbot using Large Language Models?

Analytics Vidhya

Introduction This article covers the creation of a multilingual chatbot for multilingual areas like India, utilizing large language models. The system improves consumer reach and personalization by using LLMs to translate questions between local languages and English. We go over the architecture, implementation specifics, advantages, and required actions.

Modeling 344
article thumbnail

Tea Shop se adapta a las nuevas demandas del cliente gracias a la digitalización

CIO Business Intelligence

Hace más de tres décadas, nacía en el barrio barcelonés de Gracia una compañía especialista en té e infusiones al que pocos encontraban futuro. ¿La razón? Por aquel entonces, este tipo de bebidas no eran opciones de consumo muy extendidas en España. Sin embargo, en los últimos años, y sobre todo tras la incorporación de Joaquín María López como director general de la compañía en 2018, la enseña ha crecido hasta convertirse en uno de los referentes en el mundo del té e infusiones a granel.

Marketing 104
Insiders

Sign Up for our Newsletter

This site is protected by reCAPTCHA and the Google Privacy Policy and Terms of Service apply.

Trending Sources

article thumbnail

Chart Snapshot: Contour Plots

The Data Visualisation Catalogue

A Contour Plot is a visualisation method used to represent a 3D plotted surface onto a 2D graph. It displays the relationship and changes between two independent variables (X and Y) and a dependent variable (Z). On a Contour Plot, the X and Y variables are plotted on the horizontal and vertical axes, while the Z variable is represented by contour lines or coloured bands.

article thumbnail

Stay alert! Security is everyone's responsibility

Data Science and Beyond

Questions to assess the security posture of a startup, focusing on basic hygiene and handling of sensitive data.

40
article thumbnail

Provide Real Value in your Applications with Data and Analytics

The complexity of financial data, the need for real-time insight, and the demand for user-friendly visualizations can seem daunting when it comes to analytics - but there is an easier way. With Logi Symphony, we aim to turn these challenges into opportunities. Our platform empowers you to seamlessly integrate advanced data analytics, generative AI, data visualization, and pixel-perfect reporting into your applications, transforming raw data into actionable insights.