The Benefits and Drawbacks of DataOps in Practice
DataKitchen
NOVEMBER 12, 2021
The post The Benefits and Drawbacks of DataOps in Practice first appeared on DataKitchen.

DataKitchen
NOVEMBER 12, 2021
The post The Benefits and Drawbacks of DataOps in Practice first appeared on DataKitchen.

David Menninger's Analyst Perspectives
NOVEMBER 16, 2021
Talend is a data integration and management software company that offers applications for cloud computing, big data integration, application integration, data quality and master data management. The platform enables personnel to work with relational databases, Apache Hadoop, Spark and NoSQL databases for cloud or on-premises jobs. Talend data integration software offers an open and scalable architecture and can be integrated with multiple data warehouses, systems and applications to provide a un
This site is protected by reCAPTCHA and the Google Privacy Policy and Terms of Service apply.

Analytics Vidhya
NOVEMBER 29, 2021
This article was published as a part of the Data Science Blogathon. SQL stands for Structured Query Language which is used to deal with Relational Databases to query from and manipulate databases. In the field of Data Science most of the time you are supposed to fetch the data from any RDBMS and run some […]. The post A Complete Beginner-Friendly Guide to SQL for Data Science appeared first on Analytics Vidhya.

datapine
NOVEMBER 11, 2021
Table of Contents. 1) Benefits Of Business Intelligence Software. 2) Top Business Intelligence Features. a) Data Connectors Features. b) Analytics Features. c) Dashboard Features. d) Reporting Features. For a few years now, Business Intelligence (BI) has helped companies to collect, analyze, monitor, and present their data in an efficient way to extract actionable insights that will ensure sustainable growth.
Advertiser: ZoomInfo
AI adoption is reshaping sales and marketing. But is it delivering real results? We surveyed 1,000+ GTM professionals to find out. The data is clear: AI users report 47% higher productivity and an average of 12 hours saved per week. But leaders say mainstream AI tools still fall short on accuracy and business impact. Download the full report today to see how AI is being used — and where go-to-market professionals think there are gaps and opportunities.

KDnuggets
NOVEMBER 29, 2021
The hiring run for data scientists continues along at a strong clip around the world. But, there are other emerging roles that are demonstrating key value to organizations that you should consider based on your existing or desired skill sets.

Smart Data Collective
NOVEMBER 21, 2021
If you have not lived under a rock for several years, you have undoubtedly heard about artificial intelligence (AI). However, how might artificial intelligence be used in e-commerce operations? Artificial intelligence (AI) is starting to fill every facet of our daily lives. For example, self-checkout cash registers, airport security checks, and other automated processes all use artificial intelligence to some degree.
Data Leaders Brief brings together the best content for data, strategy, and BI professionals from the widest variety of industry thought leaders.
David Menninger's Analyst Perspectives
NOVEMBER 9, 2021
How does your organization define and display its metrics? I believe many organizations are not defining and displaying metrics in a way that benefits them most. If an organization goes through the trouble of measuring and reporting on a metric, the analysis ought to include all the information needed to evaluate that metric effectively. A number, by itself, does not provide any indication of whether the result is good or bad.

Analytics Vidhya
NOVEMBER 23, 2021
This article was published as a part of the Data Science Blogathon. Overview. Regression analysis is used to solve problems of prediction based on data statistical parameters. In this article, we will look at the use of a polynomial regression model on a simple example using real statistic data. We will analyze the relationship between […]. The post Building an end-to-end Polynomial Regression Model in R appeared first on Analytics Vidhya.
Juice Analytics
NOVEMBER 22, 2021
Whether you are a consultant, marketer, researcher, or financial analyst…a big part of your job is presenting data. It takes a special combination of skills to articulate your insights and support them with effectively visualized data. You need to be part salesperson, part data analyst, and part author. We’ve collected 11 of the most useful tips and resources to help you improve how you present data.

KDnuggets
NOVEMBER 29, 2021
Check out this tutorial on how to approach sentiment classification with supervised machine learning algorithms.

Speaker: Ben Epstein, Stealth Founder & CTO | Tony Karrer, Founder & CTO, Aggregage
When tasked with building a fundamentally new product line with deeper insights than previously achievable for a high-value client, Ben Epstein and his team faced a significant challenge: how to harness LLMs to produce consistent, high-accuracy outputs at scale. In this new session, Ben will share how he and his team engineered a system (based on proven software engineering approaches) that employs reproducible test variations (via temperature 0 and fixed seeds), and enables non-LLM evaluation m

Smart Data Collective
NOVEMBER 17, 2021
More companies than ever are being driven by data. They use a number of important data analytics tools to help implement their functions more efficiently. Unfortunately, big data can be mysterious for many companies. Only 13% of companies with data strategies are meeting the objectives outlined in them. They need to know how to use it effectively to get the most value out of it.

DataKitchen
NOVEMBER 4, 2021
The post The vast majority of data engineers are burnt out. Those working in healthcare are no exception first appeared on DataKitchen.
David Menninger's Analyst Perspectives
NOVEMBER 24, 2021
Organizations have become more agile and responsive, in part, as a result of being more agile with their information technology. Adopting a DevOps approach to application deployment has allowed organizations to deploy new and revised applications more quickly. DataOps is enabling organizations to be more agile in their data processes. As organizations are embracing artificial intelligence (AI) and machine learning (ML), they are recognizing the need to adopt MLOps.
Analytics Vidhya
NOVEMBER 21, 2021
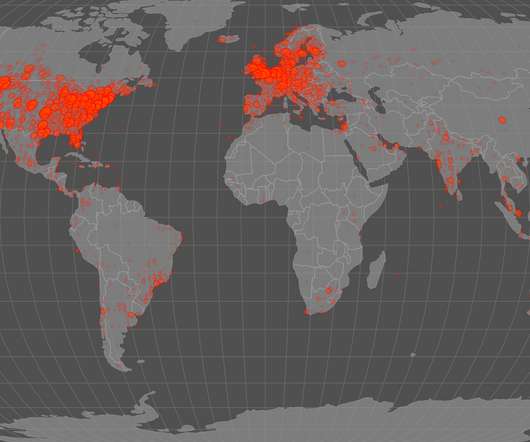
This article was published as a part of the Data Science Blogathon. Humankind has always looked up to the stars. Since the dawn of civilization, we have mapped constellations, named planets after Gods and so on. We have seen signs and visions in celestial bodies. In the previous century, we finally had the technology to […]. The post Using Data Visualization to Explore the Human Space Race!
Advertisement
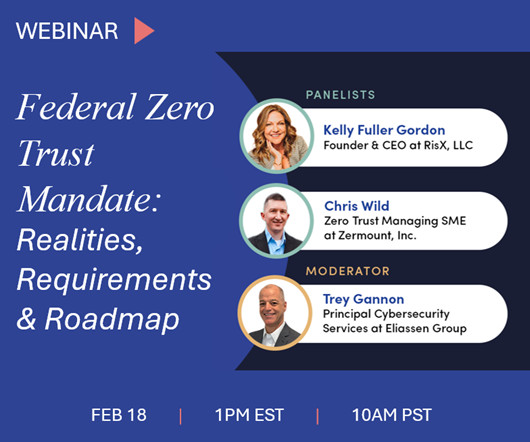
The DHS compliance audit clock is ticking on Zero Trust. Government agencies can no longer ignore or delay their Zero Trust initiatives. During this virtual panel discussion—featuring Kelly Fuller Gordon, Founder and CEO of RisX, Chris Wild, Zero Trust subject matter expert at Zermount, Inc., and Principal of Cybersecurity Practice at Eliassen Group, Trey Gannon—you’ll gain a detailed understanding of the Federal Zero Trust mandate, its requirements, milestones, and deadlines.
Juice Analytics
NOVEMBER 2, 2021
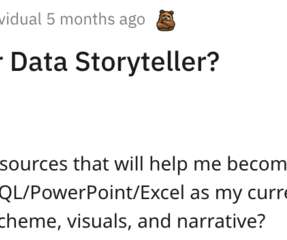
How to get started with data storytelling? For the beginner — and even for the experienced data analyst or data scientist — data storytelling can be a vague, disorientating concept. This question posted on Reddit is a good example of the interest and confusion about the topic: …which was then followed by this pure-gold response: I hope to make data storytelling a bit more accessible by laying out some of the basic concepts and skills required.

KDnuggets
NOVEMBER 23, 2021
Sure, we all make mistakes -- which can be a bit more painful when we are trying to get hired -- so check out these typical errors applicants make while answering SQL questions during data science interviews.

Smart Data Collective
NOVEMBER 12, 2021
One of the best things about digital marketing is that it’s often at the forefront of the latest online technologies. It doesn’t get any more cutting-edge at the moment than machine learning, and it’s not only large companies that have already started to take advantage. As far back as 2018, a veritable eternity in the world of online marketing, over 80% of marketing organizations reported the deployment or growth of their AI and machine learning efforts.

DataKitchen
NOVEMBER 4, 2021
Data organizations often have a mix of centralized and decentralized activity. DataOps concerns itself with the complex flow of data across teams, data centers and organizational boundaries. It expands beyond tools and data architecture and views the data organization from the perspective of its processes and workflows. The DataKitchen Platform is a “ process hub” that masters and optimizes those processes.
Advertisement
GAP's AI-Driven QA Accelerators revolutionize software testing by automating repetitive tasks and enhancing test coverage. From generating test cases and Cypress code to AI-powered code reviews and detailed defect reports, our platform streamlines QA processes, saving time and resources. Accelerate API testing with Pytest-based cases and boost accuracy while reducing human error.

David Menninger's Analyst Perspectives
NOVEMBER 3, 2021
Our research shows that nearly all financial service organizations (97%) consider it important to accelerate the flow of information and improve responsiveness. Even just a few years ago, capturing and evaluating this information quickly was much more challenging, but with the advent of streaming data technologies that capture and process large volumes of data in real time, financial service organizations can quickly turn events into valuable business outcomes in the form of new products and ser

Analytics Vidhya
NOVEMBER 15, 2021
This article was published as a part of the Data Science Blogathon Introduction In this article, you will learn how to build a face-recognition system using Python. Face recognition is a step further to face detection. In face detection, we only detect the location of the human face in an image but in face recognition, we […]. The post Build Face Recognition Attendance System using Python appeared first on Analytics Vidhya.
Juice Analytics
NOVEMBER 11, 2021
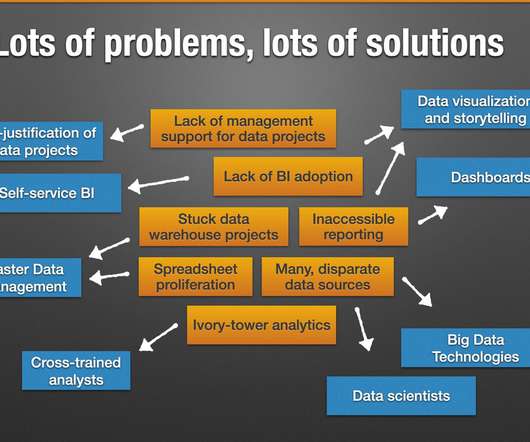
When it comes to using data, many organizations are reminiscent of the famous poem “Rime of the Ancient Mariner”: “Water, water, every where, Nor any drop to drink”. Data is everywhere, but it seldom seems to quench the thirst for smarter decisions. (As a side-note, this poem originated the phrase “albatross around your neck” — which is how a lot of CIOs and CTOs feel with both the data and expectations.

KDnuggets
NOVEMBER 26, 2021
Learn to use custom Named Entity Recognition and Relation Extraction models.

Advertisement
Many software teams have migrated their testing and production workloads to the cloud, yet development environments often remain tied to outdated local setups, limiting efficiency and growth. This is where Coder comes in. In our 101 Coder webinar, you’ll explore how cloud-based development environments can unlock new levels of productivity. Discover how to transition from local setups to a secure, cloud-powered ecosystem with ease.
Smart Data Collective
NOVEMBER 12, 2021
According to the 2021 CMO Spend Survey by Gartner, budget allocation for marketing analytics failed to make the top 3 in priority falling behind digital commerce, marketing operations and brand strategy. While I understand that selling products, cutting costs and delivering brand strategy is important for long term business results, the lack of priority in using data troubles me.

DataKitchen
NOVEMBER 2, 2021
The post Battle for Data Pros Heats Up as Burnout Builds first appeared on DataKitchen.
David Menninger's Analyst Perspectives
NOVEMBER 30, 2021
TIBCO is a large, independent cloud-computing and data analytics software company that offers integration, analytics, business intelligence and events processing software. It enables organizations to analyze streaming data in real time and provides the capability to automate analytics processes. It offers more than 200 connectors, more than 200 enterprise cloud computing and application adapters, and more than 30 non-relational structured query language databases, relational database management

Analytics Vidhya
NOVEMBER 18, 2021
This article was published as a part of the Data Science Blogathon. Introduction to Sankey Diagram for Data Visualization Very often, we are in a situation where we would have to visualize how data flows between entities. For example, let’s take the case of how residents have migrated from one country to another within the […]. The post Here’s How to use Sankey Diagrams for Data Visualization appeared first on Analytics Vidhya.

Advertisement
Large enterprises face unique challenges in optimizing their Business Intelligence (BI) output due to the sheer scale and complexity of their operations. Unlike smaller organizations, where basic BI features and simple dashboards might suffice, enterprises must manage vast amounts of data from diverse sources. What are the top modern BI use cases for enterprise businesses to help you get a leg up on the competition?

Cloudera
NOVEMBER 17, 2021
It’s no secret that Data Scientists have a difficult job. It feels like a lifetime ago that everyone was talking about data science as the sexiest job of the 21st century. Heck, it was so long ago that people were still meeting in person! Today, the sexy is starting to lose its shine. There’s recognition that it’s nearly impossible to find the unicorn data scientist that was the apple of every CEO’s eye in 2012.

KDnuggets
NOVEMBER 19, 2021
The terms ‘data science’ and ‘machine learning’ are often used interchangeably. But while they are related, there are some glaring differences, so let’s take a look at the differences between the two disciplines, specifically as it relates to programming.

Smart Data Collective
NOVEMBER 22, 2021
Big data has been a powerful force of change in the fitness industry. More fitness companies are using data analytics, AI and other technology to better understand their customers, improve their operating margins and make other changes to adapt to new trends. If you are running a fitness business, then you can’t afford to overlook the importance of big data.

DataKitchen
NOVEMBER 20, 2021
What makes an effective DataOps Engineer? A DataOps Engineer shepherds process flows across complex corporate structures. Organizations have changed significantly over the last number of years and even more dramatically over the previous 12 months, with the sharp increase in remote work. A DataOps engineer runs toward errors. You might ask what that means.
Advertiser: ZoomInfo
ZoomInfo customers aren’t just selling — they’re winning. Revenue teams using our Go-To-Market Intelligence platform grew pipeline by 32%, increased deal sizes by 40%, and booked 55% more meetings. Download this report to see what 11,000+ customers say about our Go-To-Market Intelligence platform and how it impacts their bottom line. The data speaks for itself!
Let's personalize your content