This site uses cookies to improve your experience. To help us insure we adhere to various privacy regulations, please select your country/region of residence. If you do not select a country, we will assume you are from the United States. Select your Cookie Settings or view our Privacy Policy and Terms of Use.
Cookie Settings
Cookies and similar technologies are used on this website for proper function of the website, for tracking performance analytics and for marketing purposes. We and some of our third-party providers may use cookie data for various purposes. Please review the cookie settings below and choose your preference.
Used for the proper function of the website
Used for monitoring website traffic and interactions
Cookie Settings
Cookies and similar technologies are used on this website for proper function of the website, for tracking performance analytics and for marketing purposes. We and some of our third-party providers may use cookie data for various purposes. Please review the cookie settings below and choose your preference.
Strictly Necessary: Used for the proper function of the website
Performance/Analytics: Used for monitoring website traffic and interactions
Despite all the advances organizations have made with respect to analytics, our most recent research shows the majority of the workforce in the majority of organizations are not using analytics and business intelligence (BI). Less than one-quarter (23%) report that one-half or more of their workforce is using analytics and BI. This is a problem. It means organizations are not enabling their workforce to perform at peak efficiency and effectiveness.
This article was published as a part of the Data Science Blogathon. There has been a debate in the industry between R and Tableau. Which is better is the question. Let us see this in today’s article. Source – Author What is Data Visualization? Data visualization is an interdisciplinary field that uses visual elements […]. The post Comparing R and Tableau for Data Visualisation appeared first on Analytics Vidhya.
I haven’t written much about AI recently. But a recent discussion of Google’s new Large Language Models (LLMs), and its claim that one of these models (named Gopher) has demonstrated reading comprehension approaching human performance , has spurred some thoughts about comprehension, ambiguity, intelligence, and will. (It’s well worth reading Do Large Models Understand Us , a more comprehensive paper by Blaise Agüera y Arcas that is heading in the same direction.).
AI adoption is reshaping sales and marketing. But is it delivering real results? We surveyed 1,000+ GTM professionals to find out. The data is clear: AI users report 47% higher productivity and an average of 12 hours saved per week. But leaders say mainstream AI tools still fall short on accuracy and business impact. Download the full report today to see how AI is being used — and where go-to-market professionals think there are gaps and opportunities.
Table of Contents. 1) What Are KPIs? 2) What Are Metrics? 3) KPIs vs Metrics: Main Differences. 4) Tips For KPI & Metrics Tracking. Performance tracking has never been easier. With the rise of modern self-service BI tools , everyone can monitor relevant performance indicators in a matter of seconds. But this is not without problems. Having the ability to analyze your data fast and efficiently doesn’t always mean you are doing it correctly.
Ventana Research recently announced its 2022 Market Agenda for Analytics , continuing the guidance we have offered for nearly two decades to help organizations derive optimal value from technology investments in order to improve business outcomes.
Ventana Research recently announced its 2022 Market Agenda for Analytics , continuing the guidance we have offered for nearly two decades to help organizations derive optimal value from technology investments in order to improve business outcomes.
This article was published as a part of the Data Science Blogathon. Introduction Mobile phones come in all sorts of prices, features, specifications and all. Price estimation and prediction is an important part of consumer strategy. Deciding on the correct price of a product is very important for the market success of a product. A new […]. The post Learn Mobile Price Prediction Through Four Classification Algorithms appeared first on Analytics Vidhya.
No, this is not a mistyping of data literacy. Yes, like everyone, I am aware of and fully on-board with the growing movement to improve data literacy in the enterprise. What I want to talk about is Data Littering, which is something else entirely. Data Littering is the deliberate act of creating and distributing data […].
More companies are relying on cloud technology than ever before. They are discovering the benefits of using the cloud to utilize data and facilitate communications between employees, customers, contractors and other stakeholders. One of the underappreciated benefits of cloud technology is that it makes it easier to work with virtual assistants. Savvy executives and small business owners realize that virtual assistants can perform many important tasks a lot more efficiently.
Table of Contents. 1) What Is A Drill Down? 2) What Is A Drill Through? 3) The Role Of Data Drilling In Reporting. 4) Drill Down & Drill Through Reporting Examples. It is no secret that the business world is becoming more data-driven by the minute. Every day, more and more decision-makers rely on data coming from multiple sources to make informed strategic decisions.
Speaker: Ben Epstein, Stealth Founder & CTO | Tony Karrer, Founder & CTO, Aggregage
When tasked with building a fundamentally new product line with deeper insights than previously achievable for a high-value client, Ben Epstein and his team faced a significant challenge: how to harness LLMs to produce consistent, high-accuracy outputs at scale. In this new session, Ben will share how he and his team engineered a system (based on proven software engineering approaches) that employs reproducible test variations (via temperature 0 and fixed seeds), and enables non-LLM evaluation m
Many organizations invest in data governance out of concern over misuse of data or potential data breaches. These are important considerations and valid aspects of data governance programs. However, good data governance also has positive impacts on organizations. For example, I have previously written about the valuable connection between the use of data catalogs and satisfaction with an organization’s data lake.
This article was published as a part of the Data Science Blogathon. An end-to-end guide on building Information Retrieval system using NLP […]. The post Search Engines Using Deep Learning appeared first on Analytics Vidhya.
The DHS compliance audit clock is ticking on Zero Trust. Government agencies can no longer ignore or delay their Zero Trust initiatives. During this virtual panel discussion—featuring Kelly Fuller Gordon, Founder and CEO of RisX, Chris Wild, Zero Trust subject matter expert at Zermount, Inc., and Principal of Cybersecurity Practice at Eliassen Group, Trey Gannon—you’ll gain a detailed understanding of the Federal Zero Trust mandate, its requirements, milestones, and deadlines.
Thanks to the rapid digital transformation , the software industry is one of the fastest-growing industries globally. Data analytics helps to determine the success of the business. Although the COVID-19 pandemic harmed several businesses, the software industry didn’t suffer much of a collapse. Digital technology has helped almost every industry.
I started a series of blog posts back in 2020 about best-practice guidelines for planning and designing enterprise reporting solutions with Power BI. To make the topics covered in this series of posts easier to find and follow, they are listed on this page: Doing Power BI The Right Way – for Enterprise Reporting | Paul Turley's SQL Server BI Blog which you can access from the main menu on the blog.
There's no free lunch in machine learning. So, determining which algorithm to use depends on many factors from the type of problem at hand to the type of output you are looking for. This guide offers several considerations to review when exploring the right ML approach for your dataset.
Why do data projects take so long? It’s exhausting — finding data, cleaning data, identifying problems in the data, creating presentations, hitting resistance.on and on. I’ve seen the struggle up close for over 15 years. It is my belief that the challenges of analytics have less to do with technology limitations and more to do with people challenges.
GAP's AI-Driven QA Accelerators revolutionize software testing by automating repetitive tasks and enhancing test coverage. From generating test cases and Cypress code to AI-powered code reviews and detailed defect reports, our platform streamlines QA processes, saving time and resources. Accelerate API testing with Pytest-based cases and boost accuracy while reducing human error.
This article was published as a part of the Data Science Blogathon. Introduction Hey folks! Data science is an emerging technology in the corporate society and it mainly deals with the data. Applying statistical analysis to data and getting insights from it is our main objective. A company wil store millions of records for analysis. A […]. The post Statistical Inference Using Python appeared first on Analytics Vidhya.
DataOps is a discipline focused on the delivery of data faster, better, and cheaper to derive business value quickly. It closely follows the best practices of DevOps although the implementation of DataOps to data is nothing like DevOps to code. This paper will focus on providing a prescriptive approach in implementing a data pipeline using a DataOps discipline for data practitioners.
Learn how DirectX visualization can improve your study and assessment of different trading instruments for maximum productivity and profitability. Analytics technology has become an invaluable aspect of modern financial trading. A growing number of traders are using increasingly sophisticated data mining and machine learning tools to develop a competitive edge.
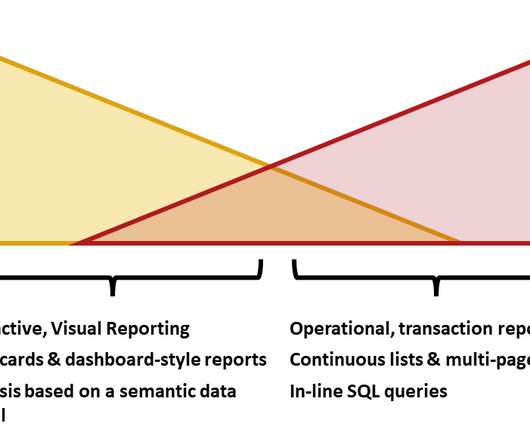
Technology evolves, the industry changes and the way businesses use technology changes. The road that has brought us to the current state of reporting capabilities in the Microsoft data platform has been long and winding. Ten years ago, we were using SQL Server Reporting Services (SSRS) to create interactive, dashboard-like reports scorecard reports.
Many software teams have migrated their testing and production workloads to the cloud, yet development environments often remain tied to outdated local setups, limiting efficiency and growth. This is where Coder comes in. In our 101 Coder webinar, you’ll explore how cloud-based development environments can unlock new levels of productivity. Discover how to transition from local setups to a secure, cloud-powered ecosystem with ease.
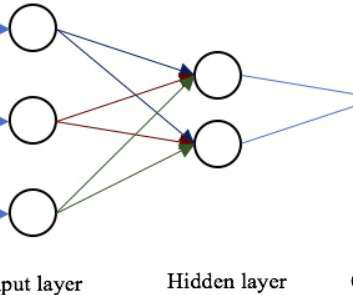
Calculus is the key to fully understanding how neural networks function. Go beyond a surface understanding of this mathematics discipline with these free course materials from MIT.
As we celebrate Black History Month, for this Employee Spotlight I sat down with Marque Blackman, co-lead of the Cloudera Black Employee Network (CBEN). We discussed his experience at Cloudera, his career transitions, and what he learned along the way. We also discussed his work with CBEN and his perspective on Black History Month. Meet Marque Blackman, Director of Global Workplace .
This article was published as a part of the Data Science Blogathon. Introduction on Logistic Regression If you are here, you are already introduced to the concept of logistic regression and probably have had your hands dirty working on different datasets. The scikitlearn’s LogisticRegression is by far the best tool to use for any logistic regression […].
Large enterprises face unique challenges in optimizing their Business Intelligence (BI) output due to the sheer scale and complexity of their operations. Unlike smaller organizations, where basic BI features and simple dashboards might suffice, enterprises must manage vast amounts of data from diverse sources. What are the top modern BI use cases for enterprise businesses to help you get a leg up on the competition?
Many people appreciate the benefits of artificial intelligence. It has already transformed many sectors, including cybersecurity and manufacturing. However, few people recognize that AI is also becoming an integral part of the writing process. Many college students and marketers are using AI to generate content. A recent study found that the market for AI in the marketing sector is worth over $107 billion.
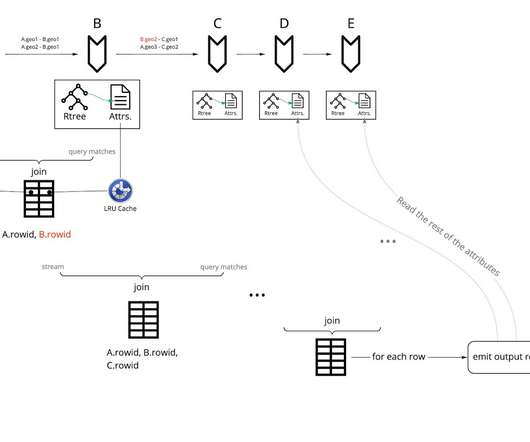
You may have not even noticed, but geospatial data has become an indispensable part of our life. We use maps and GPS trackers almost every day — generating or consuming lots of data with coordinates in one way or another. Therefore, leveraging data science to analyze this data is of interest for many individuals and organizations. Is this the case for you?
The phrase ‘data is the new oil’ has been widely used in the last number of years, but in an unrefined state, it has limited use. ISO 20022 is refined and provides the necessary structure to efficiently drive multiple engines in a bank. Background on ISO 20022. ISO 20022 was first introduced in 2004 to provide more standardization and deliver richer information for Financial Services transactions.
ZoomInfo customers aren’t just selling — they’re winning. Revenue teams using our Go-To-Market Intelligence platform grew pipeline by 32%, increased deal sizes by 40%, and booked 55% more meetings. Download this report to see what 11,000+ customers say about our Go-To-Market Intelligence platform and how it impacts their bottom line. The data speaks for itself!
We organize all of the trending information in your field so you don't have to. Join 42,000+ users and stay up to date on the latest articles your peers are reading.
You know about us, now we want to get to know you!
Let's personalize your content
Let's get even more personalized
We recognize your account from another site in our network, please click 'Send Email' below to continue with verifying your account and setting a password.


Let's personalize your content