This site uses cookies to improve your experience. To help us insure we adhere to various privacy regulations, please select your country/region of residence. If you do not select a country, we will assume you are from the United States. Select your Cookie Settings or view our Privacy Policy and Terms of Use.
Cookie Settings
Cookies and similar technologies are used on this website for proper function of the website, for tracking performance analytics and for marketing purposes. We and some of our third-party providers may use cookie data for various purposes. Please review the cookie settings below and choose your preference.
Used for the proper function of the website
Used for monitoring website traffic and interactions
Cookie Settings
Cookies and similar technologies are used on this website for proper function of the website, for tracking performance analytics and for marketing purposes. We and some of our third-party providers may use cookie data for various purposes. Please review the cookie settings below and choose your preference.
Strictly Necessary: Used for the proper function of the website
Performance/Analytics: Used for monitoring website traffic and interactions
Databricks is a data engineering and analytics cloud platform built on top of Apache Spark that processes and transforms huge volumes of data and offers data exploration capabilities through machine learning models. It can enable data engineers, data scientists, analysts and other workers to process big data and unify analytics through a single interface.
This article was published as a part of the Data Science Blogathon Snowflake is a cloud data platform that comes with a lot of unique features when compared to traditional on-premise RDBMS systems. In this tutorial, you will see the top 5 features that developers should know before implementing a solution on the Snowflake data […]. The post 5 Features Of Snowflake That Data Engineers Must Know appeared first on Analytics Vidhya.
Much has been written about struggles of deploying machine learning projects to production. As with many burgeoning fields and disciplines, we don’t yet have a shared canonical infrastructure stack or best practices for developing and deploying data-intensive applications. This is both frustrating for companies that would prefer making ML an ordinary, fuss-free value-generating function like software engineering, as well as exciting for vendors who see the opportunity to create buzz around a new
AI adoption is reshaping sales and marketing. But is it delivering real results? We surveyed 1,000+ GTM professionals to find out. The data is clear: AI users report 47% higher productivity and an average of 12 hours saved per week. But leaders say mainstream AI tools still fall short on accuracy and business impact. Download the full report today to see how AI is being used — and where go-to-market professionals think there are gaps and opportunities.
Table of Contents. 1) What Is A Weekly Report? 2) Why Are Weekly Progress Reports Important? 3) Weekly Report Templates & Examples. 4) Top Elements Of A Weekly Performance Report. Businesses have been analyzing their performance for decades through traditional written reports, but with the amount of data being produced every day, the need for more frequent reporting is growing.
I have a confession to make—I’m a back-seat driver! When sitting in a taxi, I can’t help but grumble when the ride isn’t smooth, or the driver chooses the slowest lane of traffic. I have to fight the urge to take control. When it comes to shopping, I passively accept what is offered for sale. But my wife, who grew up in Asia where haggling is part of the culture, is different.
Alteryx is a data analytics software company that offers data preparation and analytics tools to simplify and automate data wrangling, data cleaning and modeling processes, enabling line-of-business personnel to quickly access, manipulate, analyze and output data. The platform features tools to run a variety of analytic functions such as diagnostic, predictive, prescriptive and geospatial analytics in a unified platform, and can connect to various data warehouses, cloud applications, spreadsheet
This article was published as a part of the Data Science Blogathon Overview What is a Framework FrontEnd vs BackEnd What is Flask Framework Installation of Flask Creating our first Flask app Routing Static Route vs Dynamic Route HTML Injections HTML Escaping Hypertext Transfer Protocol GET and POST Methods What is a Framework? The framework […].
Kevlin Henney and I were riffing on some ideas about GitHub Copilot , the tool for automatically generating code base on GPT-3’s language model, trained on the body of code that’s in GitHub. This article poses some questions and (perhaps) some answers, without trying to present any conclusions. First, we wondered about code quality. There are lots of ways to solve a given programming problem; but most of us have some ideas about what makes code “good” or “bad.”
Table of Contents. 1) What Is A Monthly Report? 2) What Is The Purpose Of Monthly Reporting? 3) Monthly Report Templates & Examples. 4) What Does A Monthly Report Contain? From startups to big enterprises, businesses are collecting more and more data every day and, it is no secret, that whoever is not taking advantage of it will simply stay behind.
Speaker: Ben Epstein, Stealth Founder & CTO | Tony Karrer, Founder & CTO, Aggregage
When tasked with building a fundamentally new product line with deeper insights than previously achievable for a high-value client, Ben Epstein and his team faced a significant challenge: how to harness LLMs to produce consistent, high-accuracy outputs at scale. In this new session, Ben will share how he and his team engineered a system (based on proven software engineering approaches) that employs reproducible test variations (via temperature 0 and fixed seeds), and enables non-LLM evaluation m
There are countless examples of big data transforming many different industries. It can be used for something as visual as reducing traffic jams, to personalizing products and services, to improving the experience in multiplayer video games. There is no disputing the fact that the collection and analysis of massive amounts of unstructured data has been a huge breakthrough.
Access to external data can provide a competitive advantage. Our research shows that more than three-quarters (77%) of participants consider external data to be an important part of their machine learning (ML) efforts. The most important external data source identified is social media, followed by demographic data from data brokers. Organizations also identified government data, market data, environmental data and location data as important external data sources.
This article was published as a part of the Data Science Blogathon Overview Data provides us with the power to analyze and forecast the events of the future. With each day, more and more companies are adopting data science techniques like predictive forecasting, clustering, and so on. While it’s very intriguing to keep learning about complex […].
The DHS compliance audit clock is ticking on Zero Trust. Government agencies can no longer ignore or delay their Zero Trust initiatives. During this virtual panel discussion—featuring Kelly Fuller Gordon, Founder and CEO of RisX, Chris Wild, Zero Trust subject matter expert at Zermount, Inc., and Principal of Cybersecurity Practice at Eliassen Group, Trey Gannon—you’ll gain a detailed understanding of the Federal Zero Trust mandate, its requirements, milestones, and deadlines.
Let’s be frank — creating a lasting data culture in your company isn’t going to happen overnight. No technology you install or datasets you gather will do that for you. You need time and, as we’ve seen across pop culture, it usually takes a new idea or innovation (or an old idea packaged as new) to change culture. This change usually falls on data leaders to drive because they have a unique perspective across data, technology, and the organization.
We’ve collected these high-quality examples of charts and graphs to help you learn from the best. For each example, we point out some of the smart design decisions that make them effective in communicating the data. There is a lot of variety in styles and structures, but you may notice common elements across these well-designed data visualizations. For example, you’ll see… Thoughtful use of color; Few distracting elements that undermine the message; Labels and legends that highlight how to inter
Big data technology has been a highly valuable asset for many companies around the world. Countless companies are utilizing big data to improve many aspects of their business. Some of the best applications of data analytics and AI technology has been in the field of marketing. Data-Driven Marketing is More Important than Ever. The competition out there is fierce, so it is vital that you find ways to make your business stand out from the crowd.
GAP's AI-Driven QA Accelerators revolutionize software testing by automating repetitive tasks and enhancing test coverage. From generating test cases and Cypress code to AI-powered code reviews and detailed defect reports, our platform streamlines QA processes, saving time and resources. Accelerate API testing with Pytest-based cases and boost accuracy while reducing human error.
The technology industry throws around a lot of similar terms with different meanings as well as entirely different terms with similar meanings. In this post, I don’t want to debate the meanings and origins of different terms; rather, I’d like to highlight a technology weapon that you should have in your data management arsenal. We currently refer to this technology as data virtualization.
This article was published as a part of the Data Science Blogathon Overview In the current scenario, the Data science field is dominated by Python/R but there is another competition added not so long ago, Julia! which we will be exploring in this guide. The famous quote (motto) of Julia is – Looks like Python, runs […]. The post Introduction to Deep Learning in Julia appeared first on Analytics Vidhya.
Using RNNs & DeepAR Models to Find Out. Time series forecasting use cases are certainly the most common time series use cases, as they can be found in all types of industries and in various contexts. Whether it is forecasting future sales to optimize inventory, predicting energy consumption to adapt production levels, or estimating the number of airline passengers to ensure high-quality services, time is a key variable.
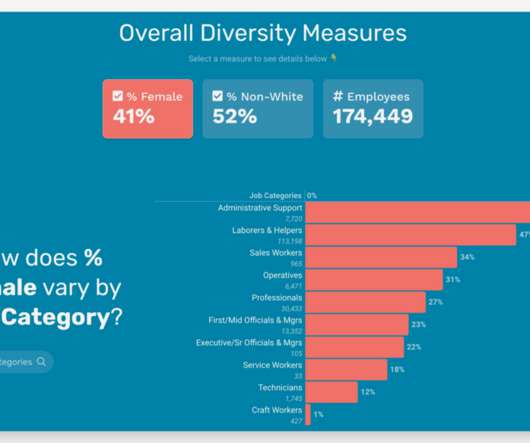
Pressure is building for companies to provide more transparency into the diversity of their workforce. Along with the #MeToo and BLM social movements, there are economic reasons why diversity data can be an indicator of company health. “A McKinsey study found that companies in the top quartile for gender diversity in corporate leadership had a 21% likelihood of outperforming bottom-quartile industry peers on profitability.
Many software teams have migrated their testing and production workloads to the cloud, yet development environments often remain tied to outdated local setups, limiting efficiency and growth. This is where Coder comes in. In our 101 Coder webinar, you’ll explore how cloud-based development environments can unlock new levels of productivity. Discover how to transition from local setups to a secure, cloud-powered ecosystem with ease.
1.145 trillion megabytes! Unbelievably, this is the amount of data that was created every day in 2021. That’s a lot of data and a lot of work for experts working in the field of data science services. Amidst growing competition, businesses are under increasing pressure to come up with unique and more cost-effective ways to manufacture and market their products.
What Is BPMN? Business process modeling notation, or BPMN, is the way BPM professionals communicate the design of a specific process, be it simple or exceedingly complex. There are various steps in any process that may come up, and notation helps a business process management (BPM) professional identify these at a glance, and to describe what needs to be done at any given point during the process based on element types.
This article was published as a part of the Data Science Blogathon This article was published as a part of the Data Science Blogathon Synopsis of Time Series Analysis A Time-Series represents a series of time-based orders. It would be Years, Months, Weeks, Days, Horus, Minutes, and Seconds A time series is an observation […]. The post A Comprehensive Guide to Time Series Analysis appeared first on Analytics Vidhya.
Large enterprises face unique challenges in optimizing their Business Intelligence (BI) output due to the sheer scale and complexity of their operations. Unlike smaller organizations, where basic BI features and simple dashboards might suffice, enterprises must manage vast amounts of data from diverse sources. What are the top modern BI use cases for enterprise businesses to help you get a leg up on the competition?
Any small or midsize business (SMB) that’s serious about making the use of data, analytics, and AI everyday behavior for everyone is using a version of the modern data stack architecture. It can even make sense in the enterprise context for teams just getting started on their AI journey.
Airflow has been adopted by many Cloudera Data Platform (CDP) customers in the public cloud as the next generation orchestration service to setup and operationalize complex data pipelines. Today, customers have deployed 100s of Airflow DAGs in production performing various data transformation and preparation tasks, with differing levels of complexity.
Satoshi Nakamoto introduced the world to bitcoin in 2008. Many people speculated that the virtual currency would never gain traction and become extinct. However, it has grown faster than even some of the staunchest supporters originally predicted. Advances in AI and machine learning technology have been important in setting the trend for bitcoin. It’s been over a decade since the cryptocurrencies were introduced to the world and since it has become increasingly popular.
ZoomInfo customers aren’t just selling — they’re winning. Revenue teams using our Go-To-Market Intelligence platform grew pipeline by 32%, increased deal sizes by 40%, and booked 55% more meetings. Download this report to see what 11,000+ customers say about our Go-To-Market Intelligence platform and how it impacts their bottom line. The data speaks for itself!
We organize all of the trending information in your field so you don't have to. Join 42,000+ users and stay up to date on the latest articles your peers are reading.
You know about us, now we want to get to know you!
Let's personalize your content
Let's get even more personalized
We recognize your account from another site in our network, please click 'Send Email' below to continue with verifying your account and setting a password.


Let's personalize your content