This site uses cookies to improve your experience. To help us insure we adhere to various privacy regulations, please select your country/region of residence. If you do not select a country, we will assume you are from the United States. Select your Cookie Settings or view our Privacy Policy and Terms of Use.
Cookie Settings
Cookies and similar technologies are used on this website for proper function of the website, for tracking performance analytics and for marketing purposes. We and some of our third-party providers may use cookie data for various purposes. Please review the cookie settings below and choose your preference.
Used for the proper function of the website
Used for monitoring website traffic and interactions
Cookie Settings
Cookies and similar technologies are used on this website for proper function of the website, for tracking performance analytics and for marketing purposes. We and some of our third-party providers may use cookie data for various purposes. Please review the cookie settings below and choose your preference.
Strictly Necessary: Used for the proper function of the website
Performance/Analytics: Used for monitoring website traffic and interactions
We read about it everywhere. The term ‘big data’ alone has become something of a buzzword in recent times – and for good reason. By leveraging the wealth of digital insights available at your fingertips and embracing the power of business intelligence , it’s possible to make more informed decisions that will lead to commercial growth, evolution, and an increased bottom line.
Introduction We are currently in the midst of a global fitness revolution. Most of the people I know are geeking out over the latest. The post How I Built Animated Plots in R to Analyze my Fitness Data (and you can too!) appeared first on Analytics Vidhya.
Or, why science and engineering are still different disciplines. "A scientist can discover a new star, but he cannot make one. He would have to ask an engineer to do it for him.". –Gordon Lindsay Glegg, The Design of Design (1969). A few months ago, I wrote about the differences between data engineers and data scientists. I talked about their skills and common starting points.
I am happy to offer some insights on Oracle drawn from our latest Value Index research, which provides an analytic representation of our assessment of how well vendors’ offerings meet buyers’ requirements. The Ventana Research Value Index: Analytics and Business Intelligence 2019 is the distillation of a year of market and product research efforts by Ventana Research.
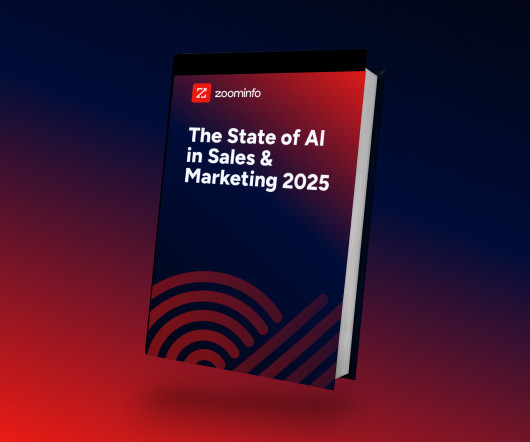
AI adoption is reshaping sales and marketing. But is it delivering real results? We surveyed 1,000+ GTM professionals to find out. The data is clear: AI users report 47% higher productivity and an average of 12 hours saved per week. But leaders say mainstream AI tools still fall short on accuracy and business impact. Download the full report today to see how AI is being used — and where go-to-market professionals think there are gaps and opportunities.
A few years ago, I generated a list of places to receive data science training. That list has become a bit stale. So, I have updated the list, adding some new opportunities, keeping many of the previous ones, and removing the obsolete ones. Here are 30 training opportunities that I encourage you to explore: The Booz Allen Field Guide to Data Science NVIDIA Deep Learning Institute Metis Data Science Training Leada’s online analytics labs Data Science Training by General Assembly Learn Data Scienc
Corinium’s data analytics events are designed to provide deep value to senior leaders and decision makers who are responsible for driving the strategic growth of data analytics within their organisations. Gert Botes , Data Analytics Portfolio Director - MEA conducted a brief interview with Abigail Britton , Data Science Lead at Anheuser-Busch InBev , who will also be presenting at CDAO Africa (17 – 18 July 2019, Johannesburg). -.
Projects are one of the cornerstones of a successful business. Sector or industry aside, strategic initiatives focused on specific areas of the business are what helps drive an organization forward, growing, progressing, and evolving year after year. Also, implementing effective management reports will create a data-driven approach to making business decisions and obtaining sustainable business success.
Projects are one of the cornerstones of a successful business. Sector or industry aside, strategic initiatives focused on specific areas of the business are what helps drive an organization forward, growing, progressing, and evolving year after year. Also, implementing effective management reports will create a data-driven approach to making business decisions and obtaining sustainable business success.
Introduction I’m a big fan of R – it’s no secret. I have relied on it since my days of learning statistics back in. The post 8 Useful R Packages for Data Science You Aren’t Using (But Should!) appeared first on Analytics Vidhya.
The O’Reilly Data Show Podcast: Neelesh Salian on data lineage, data governance, and evolving data platforms. In this episode of the Data Show , I spoke with Neelesh Salian , software engineer at Stitch Fix , a company that combines machine learning and human expertise to personalize shopping. As companies integrate machine learning into their products and systems, there are important foundational technologies that come into play.
I am happy to offer some insights on Microsoft drawn from our latest Value Index research, which provides an analytic representation of our assessment of how well vendors’ offerings meet buyers’ requirements. The Ventana Research Value Index: Analytics and Business Intelligence 2019 is the distillation of a year of market and product research efforts by Ventana Research.
Though the Agile Methodology is used heavily in software development domains, it has since spread into different sectors. With Agile comes a growing emphasis on equipping the development team, e.g. your software developers, content writers, engineers, designers, etc, with the information, tools, and direction they need to produce a tangible output within a fixed period of time, that is, sprints of typically 2 weeks.
Speaker: Ben Epstein, Stealth Founder & CTO | Tony Karrer, Founder & CTO, Aggregage
When tasked with building a fundamentally new product line with deeper insights than previously achievable for a high-value client, Ben Epstein and his team faced a significant challenge: how to harness LLMs to produce consistent, high-accuracy outputs at scale. In this new session, Ben will share how he and his team engineered a system (based on proven software engineering approaches) that employs reproducible test variations (via temperature 0 and fixed seeds), and enables non-LLM evaluation m
Very often, there is a confusion on the difference between Data Scientists and Data Engineers. Most organizations use the terms interchangeably thus causing further confusion between the exact roles and responsibilities for each profile.
Monitoring the business performance and tracking relevant insights in today’s digital age has empowered managers and c-level executives to obtain an invaluable volume of data that increases productivity and decreases costs. In fact, data has become the raw material that every business decision is based on while reporting tools create the environment to act on generated information swiftly and accurately.
Introduction Can you guess what’s common among all the faces in this image? None of these people are real! These faces were generated by. The post Top 5 Interesting Applications of GANs for Every Machine Learning Enthusiast! appeared first on Analytics Vidhya.
The O’Reilly Data Show Podcast: Avner Braverman on what’s missing from serverless today and what users should expect in the near future. In this episode of the Data Show , I spoke with Avner Braverman , co-founder and CEO of Binaris , a startup that aims to bring serverless to web-scale and enterprise applications. This conversation took place shortly after the release of a seminal paper from UC Berkeley ( “Cloud Programming Simplified: A Berkeley View on Serverless Computing” ), and this paper
The DHS compliance audit clock is ticking on Zero Trust. Government agencies can no longer ignore or delay their Zero Trust initiatives. During this virtual panel discussion—featuring Kelly Fuller Gordon, Founder and CEO of RisX, Chris Wild, Zero Trust subject matter expert at Zermount, Inc., and Principal of Cybersecurity Practice at Eliassen Group, Trey Gannon—you’ll gain a detailed understanding of the Federal Zero Trust mandate, its requirements, milestones, and deadlines.
I am happy to offer some insights on Qlik drawn from our latest Value Index research, which provides an analytic representation of our assessment of how well vendors’ offerings meet buyers’ requirements. The Ventana Research Value Index: Analytics and Business Intelligence 2019 is the distillation of a year of market and product research efforts by Ventana Research.
Visualizations are awesome. However, a good visualization is annoyingly hard to make. Moreover, it takes time and effort when it comes to present these visualizations to a bigger audience. We all know how to make Bar-Plots, Scatter Plots, and Histograms, yet we don’t pay much attention to beautify them. This hurts us?-?our credibility with peers and managers.
Ok guys , heres my first blog and I hope it’s a good start. Happy to get your feedback whether be it positive or constructive, however my objective here is to share my ideas and communicate with you regardless of where you are located. The topic is about the analytical and data story telling.
In today’s business world, competition is fierce across all industries and sectors, which means that to survive and thrive, working with measurable online data analysis and performance metrics is essential. Studies suggest that by 2020, customer experience (CX) will be the main brand differentiator (according to a research conducted by the customer experience consultant company Walker), surpassing factors such as price and product in terms of importance to today’s digitally native consumers.
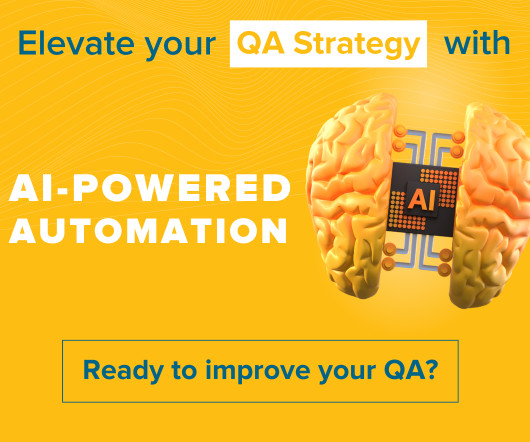
GAP's AI-Driven QA Accelerators revolutionize software testing by automating repetitive tasks and enhancing test coverage. From generating test cases and Cypress code to AI-powered code reviews and detailed defect reports, our platform streamlines QA processes, saving time and resources. Accelerate API testing with Pytest-based cases and boost accuracy while reducing human error.
Introduction I have always been fascinated with games. The seemingly infinite options available to perform an action under a tight timeline – it’s a. The post A Hands-On Introduction to Deep Q-Learning using OpenAI Gym in Python appeared first on Analytics Vidhya.
Resolving the volatility problem will unlock the groundwork needed for blockchain-based global payment systems. For cryptocurrency enthusiasts, the long game of blockchain ecosystems is to create open platforms controlled by no single authority, inviting open participation from anyone. This, of course, is in an effort to move forward the culture of open source, from static code branches sitting in source trees to living and evolving useful systems ready for live interaction, still egalitarian an
I am happy to offer some insights on Looker drawn from our latest Value Index research, which provides an analytic representation of our assessment of how well vendors’ offerings meet buyers’ requirements. The Ventana Research Value Index: Analytics and Business Intelligence 2019 is the distillation of a year of market and product research efforts by Ventana Research.
According to a UN study, 55% of the total world population is living in cities and by the year 2050, this figure could rise to a whopping 68%. The modern world is increasingly urbanized and megacities are rising faster than ever before, especially in Asian and African countries. The report highlighted that , at the present rate of development, there will be 43 megacities by 2030 and New Delhi is set to surpass Tokyo, which is currently the world’s largest city.
Many software teams have migrated their testing and production workloads to the cloud, yet development environments often remain tied to outdated local setups, limiting efficiency and growth. This is where Coder comes in. In our 101 Coder webinar, you’ll explore how cloud-based development environments can unlock new levels of productivity. Discover how to transition from local setups to a secure, cloud-powered ecosystem with ease.
Are you extracting maximum insights from your data? You know crude oil is more valuable when it’s processed. Data is the same. It’s much more valuable when you can use it to drive your business forward. Conventional data warehouses can’t handle the volume, complexity, and variety of today’s data, and they can’t empower all your teams to access and analyze that data in real time.
Plato famously quipped that “those who tell stories rule society.” This statement is as true today as it was in ancient Greece – perhaps even more so in modern times. In the contemporary world of business, the age-old art of storytelling is far from forgotten: rather than speeches on the Senate floor, businesses rely on striking data visualizations to convey information, drive engagement, and persuade audiences. .
Introduction Are you working with image data? There are so many things we can do using computer vision algorithms: Object detection Image segmentation Image. The post Build your First Multi-Label Image Classification Model in Python appeared first on Analytics Vidhya.
by Jen Underwood. So many buzzwords, so much confusion. Automated analytics, artificial intelligence (AI)-driven BI, and automated machine learning (AutoML), aren’t these terms describing the exact same thing? NO. Although these technologies may. Read More.
Large enterprises face unique challenges in optimizing their Business Intelligence (BI) output due to the sheer scale and complexity of their operations. Unlike smaller organizations, where basic BI features and simple dashboards might suffice, enterprises must manage vast amounts of data from diverse sources. What are the top modern BI use cases for enterprise businesses to help you get a leg up on the competition?
I am happy to offer some insights on Tableau drawn from our latest Value Index research, which provides an analytic representation of our assessment of how well vendors’ offerings meet buyers’ requirements. The Ventana Research Value Index: Analytics and Business Intelligence 2019 is the distillation of a year of market and product research efforts by Ventana Research.
. When you’re presenting data analytics or any technical information to a non-technical audience, it can be difficult. You have to think about the components of a good presentation in general, but also how to simplify complex subjects and information and make them resonate with your target audience. If you’re someone who understands data analytics well or is highly technical, it can be especially challenging to know how to make your presentation work for the needs of an audience which is differ
Ahead of the Chief Data Analytics Officers & Influencers, Insurance event we caught up with Dominic Sartorio, Senior Vice President for Products & Development, Protegrity to discuss how the industry is evolving. Can you tell me a bit more about your role at Protegrity? I am head of Products here, which comprises of R&D, Product Management and Global Customer support.
Videos have become the best way to connect with the right audience and followers. It’s not too hard to recognize why videos are popular these days. One sure reason is – they are an easy-to-digest format. Not only they are easy to understand but also offer your eyes a rest from the overabundance of text information available over the internet. That’s why the audience all across the world spends approx 1 billion hours to watch videos on YouTube every day.
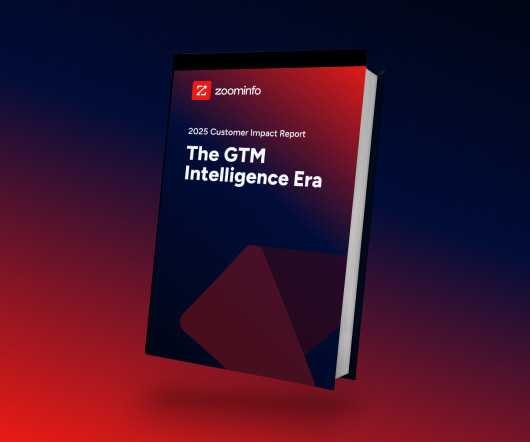
ZoomInfo customers aren’t just selling — they’re winning. Revenue teams using our Go-To-Market Intelligence platform grew pipeline by 32%, increased deal sizes by 40%, and booked 55% more meetings. Download this report to see what 11,000+ customers say about our Go-To-Market Intelligence platform and how it impacts their bottom line. The data speaks for itself!
We organize all of the trending information in your field so you don't have to. Join 42,000+ users and stay up to date on the latest articles your peers are reading.
You know about us, now we want to get to know you!
Let's personalize your content
Let's get even more personalized
We recognize your account from another site in our network, please click 'Send Email' below to continue with verifying your account and setting a password.


Let's personalize your content