This site uses cookies to improve your experience. To help us insure we adhere to various privacy regulations, please select your country/region of residence. If you do not select a country, we will assume you are from the United States. Select your Cookie Settings or view our Privacy Policy and Terms of Use.
Cookie Settings
Cookies and similar technologies are used on this website for proper function of the website, for tracking performance analytics and for marketing purposes. We and some of our third-party providers may use cookie data for various purposes. Please review the cookie settings below and choose your preference.
Used for the proper function of the website
Used for monitoring website traffic and interactions
Cookie Settings
Cookies and similar technologies are used on this website for proper function of the website, for tracking performance analytics and for marketing purposes. We and some of our third-party providers may use cookie data for various purposes. Please review the cookie settings below and choose your preference.
Strictly Necessary: Used for the proper function of the website
Performance/Analytics: Used for monitoring website traffic and interactions
Today’s marketing teams have no shortage of business questions they want to solve, yet they run into all kinds of challenges when trying to make AI a reality. One of them is wanting to democratize the use of AI and data but unable to do so due to a lack of knowledge and transparency around how AI-based technology works.
What is BI Reporting? . Business Intelligence is commonly divided into four different types: reporting, analysis, monitoring, and prediction. BI reporting is often called reporting. It is a part of BI features that allow you to extract and dynamically display data in the form of different types of visualizations such as charts and tables, so users can transform data into useful information and discover insights. .
AI adoption is reshaping sales and marketing. But is it delivering real results? We surveyed 1,000+ GTM professionals to find out. The data is clear: AI users report 47% higher productivity and an average of 12 hours saved per week. But leaders say mainstream AI tools still fall short on accuracy and business impact. Download the full report today to see how AI is being used — and where go-to-market professionals think there are gaps and opportunities.
Using the XMLA endpoint, the Power BI Premium service now includes the capabilities of SQL Server Analysis & Azure Analysis Services combined with newer data modeling capabilities of Power BI. Data models published to the Power BI service now support version control, scripted builds and team application life cycle management, enterprise IT tooling and scripted object management.
Delivering on AI and data objectives is not an easy endeavor, and many companies stumble at one of the first (and trickiest) pitfalls: knowing what - and who - to look for when planning for and staffing initiatives.
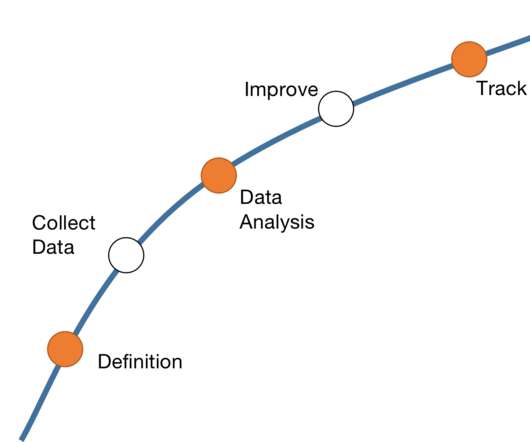
Data is a tool that is absolutely objective and can evaluate the success of product improvement, so you must develop habits to analyze data and master data analysis methodology. In the process of iterative product development, it is driven by data to ensure that the product develops in a better direction. As the controller of the product iteration direction, every time a product manager makes a decision, he should avoid “I think” such a subjective decision-making method, and instead
Data is a tool that is absolutely objective and can evaluate the success of product improvement, so you must develop habits to analyze data and master data analysis methodology. In the process of iterative product development, it is driven by data to ensure that the product develops in a better direction. As the controller of the product iteration direction, every time a product manager makes a decision, he should avoid “I think” such a subjective decision-making method, and instead
Overview matplotlib is a widely used Python library for performing data visualization and exploratory data analysis These 10 matplotlib tricks will enable you to. The post 10 matplotlib Tricks to Master Data Visualization in Python appeared first on Analytics Vidhya.
Algorithms tell stories about who people are. The first story an algorithm told about me was that my life was in danger. It was 7:53 pm on a clear Monday evening in September of 1981, at the Columbia Hospital for Women in Washington DC. I was exactly one minute old. The medical team scored me—as it does for nearly all of the 98% of American newborns who arrive in hospitals—using a ten-point scale known as the Apgar, a simple algorithm based on direct observations of newborn health.
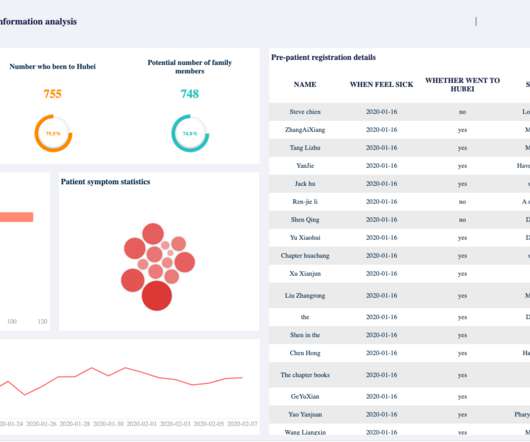
Faced with unprecedented global disruption, organizations are hungry for reliable insights to guide them through the global COVID-19 pandemic. In times of crisis, organizations often need to make tough decisions fast. That’s particularly true in the era of COVID-19, and our research shows that data and analytics is playing a central role in business decision-making as executives steer their organizations through the unfolding pandemic.
In recent years, analytical reporting has evolved into one of the world’s most important business intelligence components, compelling companies to adapt their strategies based on powerful data-driven insights. While many companies struggle to leverage an effective business intelligence strategy, the importance of analytical information created a fluctuation of data that cannot be simply collected into a single spreadsheet.
Speaker: Ben Epstein, Stealth Founder & CTO | Tony Karrer, Founder & CTO, Aggregage
When tasked with building a fundamentally new product line with deeper insights than previously achievable for a high-value client, Ben Epstein and his team faced a significant challenge: how to harness LLMs to produce consistent, high-accuracy outputs at scale. In this new session, Ben will share how he and his team engineered a system (based on proven software engineering approaches) that employs reproducible test variations (via temperature 0 and fixed seeds), and enables non-LLM evaluation m
Introduction Every once in a while, a machine learning framework or library changes the landscape of the field. Today, Facebook open sourced one such. The post Facebook AI Launches DEtection TRansformer (DETR) – A Transformer based Object Detection Approach! appeared first on Analytics Vidhya.
PODCAST: COVID 19 | Redefining Digital Enterprises. Episode 6: The Impact of COVID-19 on Supply Chain Management. Listening time: 13 minutes. The Impact of COVID-19 on Supply Chain Management. In this episode of AI to Impact podcast, Arun Krishnamoorthy, VP, Supply Chain Practice at BRIDGEi2i, discusses how the pandemic has affected the Supply Chain ecosystems throwing their sourcing network, lead times and data pipelines off balance.
Supply Chain organizations need visibility now to leverage data for making decisions and taking action, both in times of crisis and in relative stability.
The DHS compliance audit clock is ticking on Zero Trust. Government agencies can no longer ignore or delay their Zero Trust initiatives. During this virtual panel discussion—featuring Kelly Fuller Gordon, Founder and CEO of RisX, Chris Wild, Zero Trust subject matter expert at Zermount, Inc., and Principal of Cybersecurity Practice at Eliassen Group, Trey Gannon—you’ll gain a detailed understanding of the Federal Zero Trust mandate, its requirements, milestones, and deadlines.
Highlights Tokenization is a key (and mandatory) aspect of working with text data We’ll discuss the various nuances of tokenization, including how to handle. The post What is Tokenization in NLP? Here’s All You Need To Know appeared first on Analytics Vidhya.
As artificial intelligence, machine learning, and data science are fundamentally changing the world, we need to investigate how they’re impacting finance and algorithmic trading, particularly at a time when markets are so vulnerable and volatile.
In episode 8 we talk to Youmna Borghol about the evolution of the Chief Data Officer role in the Middle East. And take a deep dive into how data analytics is used in the media sector.
As interest and participation in on-demand training across the globe continues to rise, we at Dataiku wanted to find new ways for our customers and users to get the information they need when – and how – they want. That’s why we’re excited to announce the launch of Dataiku Academy , our set of in-depth online video courses and certificate programs.
GAP's AI-Driven QA Accelerators revolutionize software testing by automating repetitive tasks and enhancing test coverage. From generating test cases and Cypress code to AI-powered code reviews and detailed defect reports, our platform streamlines QA processes, saving time and resources. Accelerate API testing with Pytest-based cases and boost accuracy while reducing human error.
Overview Tableau vs. Qlik Sense – Each Analytics and Business Intelligence tool has its own distinct set of features We’ll compare Tableau and Qlik. The post Tableau vs. Qlik Sense – Which Analytics and Business Intelligence Tool Should you Use? appeared first on Analytics Vidhya.
Many enterprises have a tangled data management system, comprised of an assortment of products assembled together, in an attempt to meet the complex needs of modern day data management. The labyrinth of convoluted data management systems often evolves as a natural response to data growth, diversity of data types, and varying needs based on business objectives.
Blog. In Talking Data , we delve into the rapidly evolving worlds of Natural Language Processing and Generation. Text data is proliferating at a staggering rate, and only advanced coding languages like Python and R will be able to pull insights out of these datasets at scale. Today, text data is everywhere. As humans, we can easily understand this information, but for computers it’s a complicated task.
Aplikasi pembuat laporan gratis dan open source adalah salah satu topik yang paling sering dicari di forum teknologi. Aplikasi ini berperan penting dalam membuat laporan perusahaan. Apa keuntungan dalam menggunakan aplikasi pembuat laporan yang open source? Harganya lebih murah dibandingkan aplikasi komersial. Dapat memenuhi kebutuhan pelaporan dasar.
ZoomInfo customers aren’t just selling — they’re winning. Revenue teams using our Go-To-Market Intelligence platform grew pipeline by 32%, increased deal sizes by 40%, and booked 55% more meetings. Download this report to see what 11,000+ customers say about our Go-To-Market Intelligence platform and how it impacts their bottom line. The data speaks for itself!
Introduction We are living in the midst of a global revolution right now. The business world of today is more interconnected than ever, not. The post Partner and Affiliate Monitoring: The Benefits of AI Over Traditional Methods appeared first on Analytics Vidhya.
Data modeling supports collaboration among business stakeholders – with different job roles and skills – to coordinate with business objectives. Data resides everywhere in a business , on-premise and in private or public clouds. And it exists across these hybrid architectures in different formats: big and unstructured and traditional structured business data may physically sit in different places.
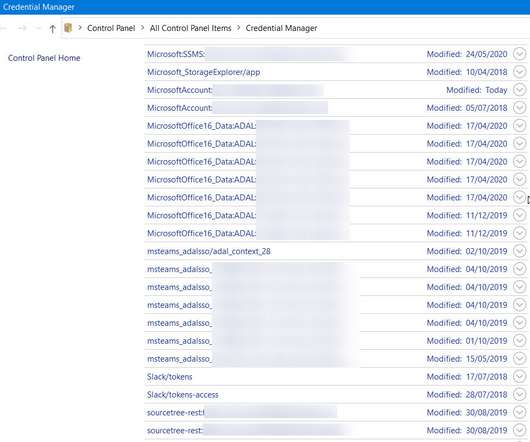
Note: This solution is provided with no warranty! Try at your own risk. I have found it hard to cheerlead Microsoft Teams because I see other customers and individuals struggle with authentication issues. I have had plenty of these issues, which involve symptoms such as: Teams cycling with mysterious errors so I can’t log in, such as ‘We are having an issue right now, please try and sign in again’ with an offer to sign me out.
The Definition of Real-time Reporting. Real time reporting is a business intelligence approach that enables users to get up-to-the-minute data reports when the related data updated in the business systems. It supports managers to monitor the performance and make wise instant decisions. Real-time reporting support massive data amounts and process user queries, while new data continues to roll in.
Many software teams have migrated their testing and production workloads to the cloud, yet development environments often remain tied to outdated local setups, limiting efficiency and growth. This is where Coder comes in. In our 101 Coder webinar, you’ll explore how cloud-based development environments can unlock new levels of productivity. Discover how to transition from local setups to a secure, cloud-powered ecosystem with ease.
Overview Pivot tables are a powerful Excel feature for quickly analyzing data and extracting business insights Here are five Pivot Table tips in Excel. The post 5 Excel Tricks You’ll Love Working with as an Analyst appeared first on Analytics Vidhya.
If you got hooked on DataCamp during our first-ever Free Week, you can now purchase a discounted annual subscription—and we’ll donate one to someone impacted by COVID-19!
I have made this longer than usual because I have not had time to make it shorter. —Blaise Pascal I was listening to a podcast the other day. The speaker had developed a theory that had really pushed his thinking. It was right on the edge of his ability to comprehend. I gave myself a self-satisfied pat on the back; I could understand it no problem. But then I thought about it some more.
Recently, I was reading Rolf Dobell’s The Art of Thinking Clearly, which made me think about cognitive biases in a way I never had before. I realized how deeply seated some cognitive biases are. In fact, we often don’t even consciously realize when our thinking is being affected by one. For data scientists, these biases can really change the way we work with data and make our day-to-day decisions, and generally not for the better.
Large enterprises face unique challenges in optimizing their Business Intelligence (BI) output due to the sheer scale and complexity of their operations. Unlike smaller organizations, where basic BI features and simple dashboards might suffice, enterprises must manage vast amounts of data from diverse sources. What are the top modern BI use cases for enterprise businesses to help you get a leg up on the competition?
We organize all of the trending information in your field so you don't have to. Join 42,000+ users and stay up to date on the latest articles your peers are reading.
You know about us, now we want to get to know you!
Let's personalize your content
Let's get even more personalized
We recognize your account from another site in our network, please click 'Send Email' below to continue with verifying your account and setting a password.


Let's personalize your content