This site uses cookies to improve your experience. To help us insure we adhere to various privacy regulations, please select your country/region of residence. If you do not select a country, we will assume you are from the United States. Select your Cookie Settings or view our Privacy Policy and Terms of Use.
Cookie Settings
Cookies and similar technologies are used on this website for proper function of the website, for tracking performance analytics and for marketing purposes. We and some of our third-party providers may use cookie data for various purposes. Please review the cookie settings below and choose your preference.
Used for the proper function of the website
Used for monitoring website traffic and interactions
Cookie Settings
Cookies and similar technologies are used on this website for proper function of the website, for tracking performance analytics and for marketing purposes. We and some of our third-party providers may use cookie data for various purposes. Please review the cookie settings below and choose your preference.
Strictly Necessary: Used for the proper function of the website
Performance/Analytics: Used for monitoring website traffic and interactions
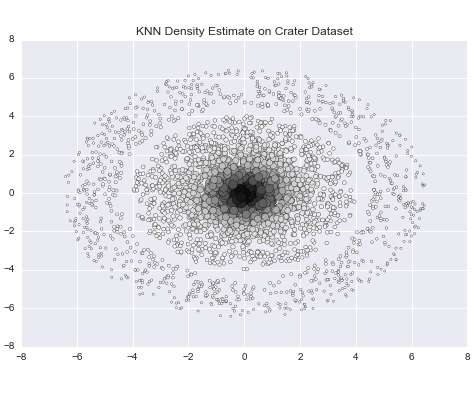
Original content by Manojit Nandi – Updated by Josh Poduska. Cluster Analysis is an important problem in data analysis. Data scientists use clustering to identify malfunctioning servers, group genes with similar expression patterns, and perform various other applications. There are many families of data clustering algorithms, and you may be familiar with the most popular one: k-means.
This article was published as a part of the Data Science Blogathon. Introduction Cluster analysis or clustering is an unsupervised machine learning algorithm that. The post A Detailed Introduction to K-means Clustering in Python! appeared first on Analytics Vidhya.
If the work of a human’s mind can be somehow represented, interactive data visualization is the closest form of such representation right before pure art. So, what is Interactive data visualization and how are they driven by modern interactive data visualization tools? Generally speaking, data visualization itself visually represents a certain database.
As the amount of data grows exponentially, organizations turn to data intelligence to reach deeper conclusions about driving revenue, achieving regulatory compliance and accomplishing other strategic objectives. It’s no secret that data has grown in volume, variety and velocity, with 2.5 quintillion bytes generated every day and 90 percent of the world’s data volume created just in the last two years.
AI adoption is reshaping sales and marketing. But is it delivering real results? We surveyed 1,000+ GTM professionals to find out. The data is clear: AI users report 47% higher productivity and an average of 12 hours saved per week. But leaders say mainstream AI tools still fall short on accuracy and business impact. Download the full report today to see how AI is being used — and where go-to-market professionals think there are gaps and opportunities.
Ocean_of_the_Stream_of_Stories. From Edward Tufte's Visual Explanations, a diagram based on Salman Rushdie‘s description of the Indian epid Kathasaritsagara or Ocean of the Streams of Story. The hot new concept in data visualization is "data storytelling"; some are calling it the next evolution of visualization (I'm one of them). However, we're early in the discussion and there are more questions than answers: Is data storytelling more than a catchy phrase?
This article was published as a part of the Data Science Blogathon. Introduction: These days if we read anything, we can see something is. The post Use of Machine Learning in Dairy farming appeared first on Analytics Vidhya.
One reason for the success of tech companies like Netflix and Airbnb: They’ve grown up with data. Not in tech? Here’s how to rebuild your company around data.
One reason for the success of tech companies like Netflix and Airbnb: They’ve grown up with data. Not in tech? Here’s how to rebuild your company around data.
Data is absolutely vital to your occupation as a business owner. After all, this information lets you understand your market better, enabling you to provide better customer experiences. However, customers aren’t as willing to share personal information with companies. In fact, a study found that 79% of Americans are concerned about how their data is being used by companies, which is not good for building trust.
When looking at your company’s monthly metrics, it’s essential to focus on a month’s worth of data. Realizing a 50% increase in sales can be encouraging, but looking at these numbers separately doesn’t necessarily provide a full picture of your business performance. A month’s metrics is worthwhile, but it can be misleading if not placed in the proper context.
This article was published as a part of the Data Science Blogathon. Introduction We all have been hearing about the buzz word – “Data. The post Nervous about your first data science project! Here are 6 easy steps to get started! appeared first on Analytics Vidhya.
Blog. Every company is becoming a data company. Data-Powered Apps delves into how product teams are infusing insights into applications and services to build products that will delight users and stand the test of time. Applications of all kinds now face increasing pressure to offer analytics and stats to users on both sides of the fence: Subscribers and members want to see their personal analytics dashboards ; business teams want to see data on those members as well as app performance.
Speaker: Ben Epstein, Stealth Founder & CTO | Tony Karrer, Founder & CTO, Aggregage
When tasked with building a fundamentally new product line with deeper insights than previously achievable for a high-value client, Ben Epstein and his team faced a significant challenge: how to harness LLMs to produce consistent, high-accuracy outputs at scale. In this new session, Ben will share how he and his team engineered a system (based on proven software engineering approaches) that employs reproducible test variations (via temperature 0 and fixed seeds), and enables non-LLM evaluation m
Artificial intelligence is shaping our world in unbelievable ways. As previously stated, it has both benefits and drawbacks. What do you think would happen if robots took over the world? Would you never have to go to school again? Or would you never have to take the bus again? Oh, wait! Will the bus now be driven by a robot? You need to think about the different ways AI is changing our world.
A common complaint of executive level management is “I know that we track a lot of data in our ERP system, but for some reason, we have a lot of difficulty gaining visibility into that information.”. That lack of visibility has many implications, including an incomplete view of the levers of profitability, time wasted tracking down information, and the inability to identify macro trends, and adjust strategy to new market conditions.
Introduction Becoming a data scientist has become like the “American Dream” – everybody wants to have it! However, for all the beginners out there. The post How can you Master Data Science without a Degree in 2020? appeared first on Analytics Vidhya.
In May, Dataiku launched Dataiku Academy , a free online learning tool to enable all users to build their skills around Dataiku DSS. Dataiku Academy is designed for every type of user — from non-technical roles to the hardcore coders — and meant to guide them through self-paced, interactive online training. Below, we share the five Dataiku Academy courses with the highest enrollment and a brief overview of what each course contains so you can decide which ones to take in the new year.
The DHS compliance audit clock is ticking on Zero Trust. Government agencies can no longer ignore or delay their Zero Trust initiatives. During this virtual panel discussion—featuring Kelly Fuller Gordon, Founder and CEO of RisX, Chris Wild, Zero Trust subject matter expert at Zermount, Inc., and Principal of Cybersecurity Practice at Eliassen Group, Trey Gannon—you’ll gain a detailed understanding of the Federal Zero Trust mandate, its requirements, milestones, and deadlines.
Pokémon activities have changed dramatically since they first became popular over 20 years ago. Artificial intelligence has been highly influential in changing the way that the game is played. AI has even made it possible to use a fake GPS joystick for Pokémon Go with spoofing or Dr. Fone Virtual Location. Artificial intelligence has been particularly important with the Pokémon Go game.
Ensuring data quality is an important aspect of data management and these days, DBAs are increasingly being called upon to deal with the quality of the data in their database systems more than ever before. The importance of quality data cannot be overstated. Poor data quality costs the typical company between 10% and 20% of […].
This article was published as a part of the Data Science Blogathon. Introduction Random Forests are always referred to as black-box models. Let’s try. The post Lets Open the Black Box of Random Forests appeared first on Analytics Vidhya.
GAP's AI-Driven QA Accelerators revolutionize software testing by automating repetitive tasks and enhancing test coverage. From generating test cases and Cypress code to AI-powered code reviews and detailed defect reports, our platform streamlines QA processes, saving time and resources. Accelerate API testing with Pytest-based cases and boost accuracy while reducing human error.
In recent years, leading professional fields like marketing have leaned heavily on phrases like, “content is king,” but if you’ve been paying attention – not just to marketing, but to many other growing fields, including eCommerce, healthcare, and finance – the real reigning force is not content, but data. Big data, which is itself a consequence of other technology, gives us the tools to interpret our actions, to strategize and analyze in new and more objective ways.
Digital transformation consulting organizations such as Treehouse have the opportunity to observe successful transformation projects along with others that are floundering or have been abandoned. Based on this observation and analysis, we see that a well thought out roadmap for digital transformation of your organization dramatically increases the probability of success.
This article was published as a part of the Data Science Blogathon. Introduction The general principle of ensembling is to combine the predictions of various. The post Improve your Predictive Model’s Score using a Stacking Regressor appeared first on Analytics Vidhya.
This is an update on the project, as it’s been a while since I last posted on this blog. I felt I would be doing the users of this website a disservice if I didn’t explain my absence and the lack of new content. But the reasons I’ve been away have been for (I believe) mostly good reasons, that have contributed greatly to developing my understanding of data visualisation and how to teach it to others.
ZoomInfo customers aren’t just selling — they’re winning. Revenue teams using our Go-To-Market Intelligence platform grew pipeline by 32%, increased deal sizes by 40%, and booked 55% more meetings. Download this report to see what 11,000+ customers say about our Go-To-Market Intelligence platform and how it impacts their bottom line. The data speaks for itself!
Automation is a growing market throughout the world. According to many experts, it is expected to be worth $83 billion by the end of next year. The appeal of automation becomes a lot more evident when you understand its capabilities. Data automation, in particular, can offer some tremendous benefits. Understanding the Phenomenal Benefits of Data Automation.
We’ve been working on something we call “SemOps” (like DevOps but for Semantic Technology + IT Operations). The basic idea is how can we create a pipeline to go from proposed enterprise ontology or taxonomy enhancements to “in-production” as frictionlessly as possible. As so often happens, when we shine the Semantic Light on a topic […].
This article was published as a part of the Data Science Blogathon. Introduction We, as human beings, make multiple decisions throughout the day. For. The post Popular Classification Models for Machine Learning appeared first on Analytics Vidhya.
Finance teams often work with business intelligence (BI) tools to analyze data, identify trends, pinpoint discrepancies, and build informative, compelling reports for management. Unfortunately, most BI tools require substantial development effort just to get up and running, such as deep technical expertise, access to development software such as Visual Studio.net, and a significant time commitment.
Many software teams have migrated their testing and production workloads to the cloud, yet development environments often remain tied to outdated local setups, limiting efficiency and growth. This is where Coder comes in. In our 101 Coder webinar, you’ll explore how cloud-based development environments can unlock new levels of productivity. Discover how to transition from local setups to a secure, cloud-powered ecosystem with ease.
After a tumultuous year, the final award category at the Data Impact Awards was a much needed pick me up for everyone in attendance. Showcasing some of the most inspiring and uplifting use cases of Cloudera’s technology, The Data for Good category recognizes organizations that are tackling the challenging issues affecting society and the planet — and we all know there are plenty of them in 2020!
The short answer is: No, robotic process automation (RPA) and artificial intelligence (AI) are not the same thing. However, they are two complementary technologies that can increase efficiency in a wide range of business processes.
This article was published as a part of the Data Science Blogathon. Introduction A job search can be the most frustrating periods of your. The post How to accelerate Data Science job search in 2021 appeared first on Analytics Vidhya.
Classic, agile or hybrid project management – what do I choose in a project? The Stacey Matrix (after the organizational theorist Ralph D. Stacey) can provide a decision support. A criteria catalog is used to assess how well a project plan is already understood – in terms of requirements on the one hand and the … Continue reading "Complicated vs.
Large enterprises face unique challenges in optimizing their Business Intelligence (BI) output due to the sheer scale and complexity of their operations. Unlike smaller organizations, where basic BI features and simple dashboards might suffice, enterprises must manage vast amounts of data from diverse sources. What are the top modern BI use cases for enterprise businesses to help you get a leg up on the competition?
We organize all of the trending information in your field so you don't have to. Join 42,000+ users and stay up to date on the latest articles your peers are reading.
You know about us, now we want to get to know you!
Let's personalize your content
Let's get even more personalized
We recognize your account from another site in our network, please click 'Send Email' below to continue with verifying your account and setting a password.


Let's personalize your content