This site uses cookies to improve your experience. To help us insure we adhere to various privacy regulations, please select your country/region of residence. If you do not select a country, we will assume you are from the United States. Select your Cookie Settings or view our Privacy Policy and Terms of Use.
Cookie Settings
Cookies and similar technologies are used on this website for proper function of the website, for tracking performance analytics and for marketing purposes. We and some of our third-party providers may use cookie data for various purposes. Please review the cookie settings below and choose your preference.
Used for the proper function of the website
Used for monitoring website traffic and interactions
Cookie Settings
Cookies and similar technologies are used on this website for proper function of the website, for tracking performance analytics and for marketing purposes. We and some of our third-party providers may use cookie data for various purposes. Please review the cookie settings below and choose your preference.
Strictly Necessary: Used for the proper function of the website
Performance/Analytics: Used for monitoring website traffic and interactions
This is an introduction to a series of posts and pages that will provide a comprehensive set of best practices for successful Power BI solutions. In previous posts, I have asked readers to suggest topics for future posts. Based on that and other feedback, I will be addressing questions and suggested topics.
Overview Pandas provide tools and techniques to make data analysis easier in Python We’ll discuss tips and tricks that will help you become a. The post 5 Striking Pandas Tips and Tricks for Analysts and Data Scientists appeared first on Analytics Vidhya.
The world bought into the idea of continual improvement ever since Japanese car companies embraced it in the ‘70s and ate Detroit's lunch. But you can’t improve what you can’t measure – which is why analytics now envelops the entire enterprise, crunching every data set it can find to get a clear view of current reality and suggest a better road ahead.
The Open Group Architecture Framework (TOGAF) is a type of enterprise architecture (EA) framework. In this post, we’ll cover: What Is TOGAF? History of TOGAF. TOGAF ADM. The Benefits of TOGAF. Is TOGAF Free? TOGAF vs. DODAF vs. MODAF vs. NAF. Implementing an EA Framework. What Is TOGAF? TOGAF is one example of an enterprise architecture framework. Enterprise architecture frameworks help organizations regulate the methods and language used to create, describe and administer changes to an enterpri
AI adoption is reshaping sales and marketing. But is it delivering real results? We surveyed 1,000+ GTM professionals to find out. The data is clear: AI users report 47% higher productivity and an average of 12 hours saved per week. But leaders say mainstream AI tools still fall short on accuracy and business impact. Download the full report today to see how AI is being used — and where go-to-market professionals think there are gaps and opportunities.
Overview Learn to use KNNimputer to impute missing values in data Understand the missing value and its types Introduction KNNImputer by scikit-learn is a. The post KNNImputer: A robust way to impute missing values (using Scikit-Learn) appeared first on Analytics Vidhya.
Persona-driven learning journeys for data roles are a new way to think company-wide data upskilling. Here’s how to use personas to structure your company’s training program.
Persona-driven learning journeys for data roles are a new way to think company-wide data upskilling. Here’s how to use personas to structure your company’s training program.
While folks that work on information technology (IT) and data science teams likely have very different job functions, one commonality is that both teams need to have an understanding of the greater business in order to effectively collaborate with key stakeholders, define success, and continuously improve. Why, though, don’t these teams always understand each other?
Mainframes continue to excel at traditional tasks such as high-speed transaction processing and running large batch workloads. Mainframes also can easily handle large amounts of data—multiple terabytes—such as is needed for analytical processing and machine learning. Indeed, the mainframe supports both traditional and modern applications and data management requirements, making it a key component of […].
Introduction The global spread of the internet has made the availability of knowledge easy. Every information is at the grasp of our palms. As. The post 8 Business Analytics Books to Begin Your Journey appeared first on Analytics Vidhya.
Deal furthers mission to deliver powerful portfolio of enterprise software solutions for Office of the CFO; expands real-time financial reporting capabilities for top ERPs Sage and Viewpoint. RALEIGH, N.C. – July 16, 2020 – insightsoftware , a global provider of enterprise software solutions for the Office of the CFO, today announced it has acquired Event 1 Software , a provider of intelligent, Excel-based reporting solutions.
Speaker: Ben Epstein, Stealth Founder & CTO | Tony Karrer, Founder & CTO, Aggregage
When tasked with building a fundamentally new product line with deeper insights than previously achievable for a high-value client, Ben Epstein and his team faced a significant challenge: how to harness LLMs to produce consistent, high-accuracy outputs at scale. In this new session, Ben will share how he and his team engineered a system (based on proven software engineering approaches) that employs reproducible test variations (via temperature 0 and fixed seeds), and enables non-LLM evaluation m
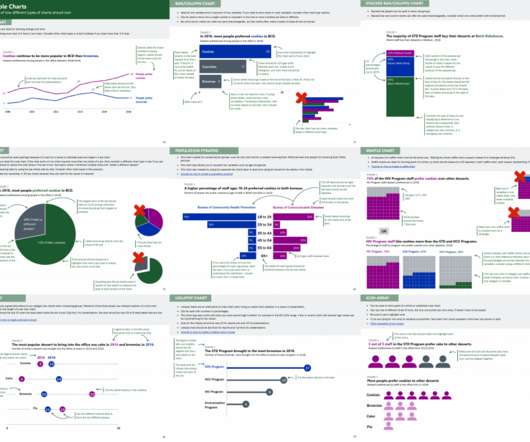
Did you see Sara DeLong’s post on Why You Need to Create a Data Visualization Style Guide to Tell Great Stories? You’ll love Part 2. –Ann. — So you decided your organization needs a style guide to save lots your team lots of time when creating charts, enhance brand cohesion, and improve trust with your stakeholders. In my previous post I described how to identify if your team needs a Data Visualization Style Guide, how to secure buy-in from leadership and your coworkers,
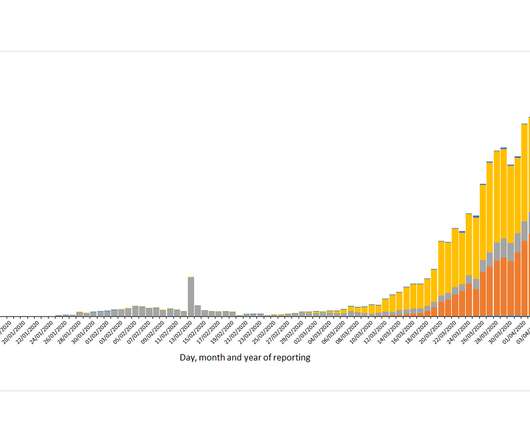
The COVID-19 pandemic has profoundly disrupted supply chains across the globe. This is especially true in the manufacturing industry, where supply chain managers must track and analyze the pandemic’s impact in every region that effects their business: Is it safe to bring staff into factories? Are suppliers still shipping — or even still in business?
Introduction SQL Keys is the Key to your success in Analytics! Data is growing at an exponential rate and so is the demand for. The post Difference between SQL Keys (Primary Key, Super Key, Candidate Key, Foreign Key) appeared first on Analytics Vidhya.
Building financial models is a key function of the financial planning and analysis (FP&A) group and provides a powerful tool for analyzing a diverse set of possible scenarios. Budget modeling is perhaps the most widely applicable form of financial modeling. The budget model allows your organization to better anticipate what’s truly important in your business.
The DHS compliance audit clock is ticking on Zero Trust. Government agencies can no longer ignore or delay their Zero Trust initiatives. During this virtual panel discussion—featuring Kelly Fuller Gordon, Founder and CEO of RisX, Chris Wild, Zero Trust subject matter expert at Zermount, Inc., and Principal of Cybersecurity Practice at Eliassen Group, Trey Gannon—you’ll gain a detailed understanding of the Federal Zero Trust mandate, its requirements, milestones, and deadlines.
The COVID-19 pandemic has affected every fragment of society, bringing the world to a halt. The streets are empty, offices are no longer bustling and commercial spaces have run out of life. To curb the spread of COVID-19, government authorities around the world have imposed strict social distancing protocols that have restricted the movement of people at public places. .
The days are gone when defining a user experience was limited to the choice of designers. Now data plays a more important role in the design process than ever before.
Introduction The best way to track the COVID-19 outbreak is by using data and visualization. The COVID-19 patterns are sometimes contradictory and this is. The post Top 20 Visualization Dashboards for Mapping COVID-19 appeared first on Analytics Vidhya.
Blog. In Navigating Change in Crisis , we explore how individuals and companies are adapting to a “new normal” in order to keep essential services functioning. We provide actionable advice around how organizations, and ultimately the builders of data and analytic apps, are adapting to meet these changes. These insights aim to help you and your team navigate these unprecedented times.
GAP's AI-Driven QA Accelerators revolutionize software testing by automating repetitive tasks and enhancing test coverage. From generating test cases and Cypress code to AI-powered code reviews and detailed defect reports, our platform streamlines QA processes, saving time and resources. Accelerate API testing with Pytest-based cases and boost accuracy while reducing human error.
For the better part of 15 years, SQL Server Integration Services (SSIS) has been the go-to enterprise extract-transform-load (ETL) tool for shops running on Microsoft SQL Server. More recently, Microsoft added Azure Data Factory (ADF) to its stable of enterprise ETL tools. In this post, I’ll be comparing SSIS and Azure Data Factory to share how they are alike and.
As you may know, Amnon Drori is the co-founder and CEO of Octopai. What you may not know is that this is actually Amnon’s second automation-focused company. We sat down with Amnon to discuss the benefits of automation , how he sees the future for BI teams and what key factors will help businesses succeed. Q: This is the second company that you’ve chosen to work with that has focused on automation.
Introduction One of the most basic concepts in statistics is hypothesis testing. Not just in Data Science, Hypothesis testing is important in every field. The post Hypothesis Testing: A Way to Prove Your Claim Using p-value appeared first on Analytics Vidhya.
Blog. As COVID-19 continues to spread, healthcare groups and companies of all kinds are under pressure to provide care in the face of increasing demand. Healthy Data is your window into how data can help organizations address this crisis. COVID-19 required a worldwide coordinated response of medical professionals, data teams, logistics organizations, and a whole host of other experts to try to flatten the curve, improve treatments, and ultimately develop lasting remedies.
ZoomInfo customers aren’t just selling — they’re winning. Revenue teams using our Go-To-Market Intelligence platform grew pipeline by 32%, increased deal sizes by 40%, and booked 55% more meetings. Download this report to see what 11,000+ customers say about our Go-To-Market Intelligence platform and how it impacts their bottom line. The data speaks for itself!
Everyone it seems wants to be an analytic enterprise. But what does it mean to be an analytic enterprise? An analytic enterprise applies analytics deeply and broadly. It uses analytics to solve its most critical run-the-business problems. It uses increasingly advanced and analytics to maximize its ability to get value from its data. And it uses analytics everywhere – from customer treatment to operations, from marketing to administration, and from people management to asset management.
“ Garbage in, garbage out.” – George Fuechsel, early IBM programmer. GIGO may be an old refrain, but it likely gave rise to the concept of what we know as ‘business intelligence’. BI has helped enhance a company’s ability to process large amounts of data. Although this may be true, analysis loses its usefulness the longer it takes to generate.
Overview As I had promised in my previous article, now, it’s time to complete our discussion on evaluation metrics for classification problems. Today, we. The post Limitations of AUC-ROC technique appeared first on Analytics Vidhya.
Blog. In Navigating Change in Crisis, we explore how individuals and companies are adapting to a “new normal” to keep essential services functioning. We provide actionable advice around how organizations, and ultimately the builders of data and analytic apps, are adjusting to meet these changes. These insights aim to help you and your team navigate these unprecedented times.
Many software teams have migrated their testing and production workloads to the cloud, yet development environments often remain tied to outdated local setups, limiting efficiency and growth. This is where Coder comes in. In our 101 Coder webinar, you’ll explore how cloud-based development environments can unlock new levels of productivity. Discover how to transition from local setups to a secure, cloud-powered ecosystem with ease.
Everybody wants to take a relaxing holiday from time to time, whether you are a veteran DBA standing watch over million dollar mission-critical database systems or a jack-of-all-trades who maintains all of your small organization’s SQL Servers, Windows Servers, and all of the other corporate IT assets. Of course, there are those few individuals who […].
The principles and practices of data visualization do not vary from one domain to another. They are the same. Data visualization applied to business differs only from data visualization applied to education (or healthcare, or government, or various branches of science, or any other domain you can imagine) in that each domain has its own data that must be understood before it can be visualized effectively.
The impact of using specialist systems to drastically improve data mastery is clear by looking at the results of the FSN Future of Analytics in the Financial Function Global Survey report. Nevertheless, over 40 percent of companies are constrained by their technology, blocking them from maximizing their data and analytics potential. Download the full Future of Analytics in the Financial Function Report.
Deep learning is one of those often mentioned yet not quite tangible topics for most people. If you’re unfamiliar with what deep learning is, check out this blog post or this deep learning guide. Don’t worry, we’ll wait for you to return.
Large enterprises face unique challenges in optimizing their Business Intelligence (BI) output due to the sheer scale and complexity of their operations. Unlike smaller organizations, where basic BI features and simple dashboards might suffice, enterprises must manage vast amounts of data from diverse sources. What are the top modern BI use cases for enterprise businesses to help you get a leg up on the competition?
We organize all of the trending information in your field so you don't have to. Join 42,000+ users and stay up to date on the latest articles your peers are reading.
You know about us, now we want to get to know you!
Let's personalize your content
Let's get even more personalized
We recognize your account from another site in our network, please click 'Send Email' below to continue with verifying your account and setting a password.


Let's personalize your content