This site uses cookies to improve your experience. To help us insure we adhere to various privacy regulations, please select your country/region of residence. If you do not select a country, we will assume you are from the United States. Select your Cookie Settings or view our Privacy Policy and Terms of Use.
Cookie Settings
Cookies and similar technologies are used on this website for proper function of the website, for tracking performance analytics and for marketing purposes. We and some of our third-party providers may use cookie data for various purposes. Please review the cookie settings below and choose your preference.
Used for the proper function of the website
Used for monitoring website traffic and interactions
Cookie Settings
Cookies and similar technologies are used on this website for proper function of the website, for tracking performance analytics and for marketing purposes. We and some of our third-party providers may use cookie data for various purposes. Please review the cookie settings below and choose your preference.
Strictly Necessary: Used for the proper function of the website
Performance/Analytics: Used for monitoring website traffic and interactions
Introduction We are aware of the massive amounts of data being produced each day. This humungous data has lots of insights and hidden trends. The post Analysing Streaming Tweets with Python and PostgreSQL appeared first on Analytics Vidhya.
So you need to redesign your company’s data infrastructure. Do you buy a solution from a big integration company like IBM, Cloudera, or Amazon? Do you engage many small startups, each focused on one part of the problem? A little of both? We see trends shifting towards focused best-of-breed platforms. That is, products that are laser-focused on one aspect of the data science and machine learning workflows, in contrast to all-in-one platforms that attempt to solve the entire space of data workflow
In our cutthroat digital economy, massive amounts of data are gathered, stored, analyzed, and optimized to deliver the best possible experience to customers and partners. At the same time, inventory metrics are needed to help managers and professionals in reaching established goals, optimizing processes, and increasing business value. That said, It’s extremely important setting up and tracking the inventory KPIs for your business is in order to evaluate and improve your performance.
The new normal of online working is bound to introduce new habits and learning opportunities for business analysts looking to navigate the tides of the post-pandemic workplace. From running physical workshops with a room filled with eager participants to managing virtual workshops where participants are in different geographical locations with some participants perhaps preferring to hide behind their screens.
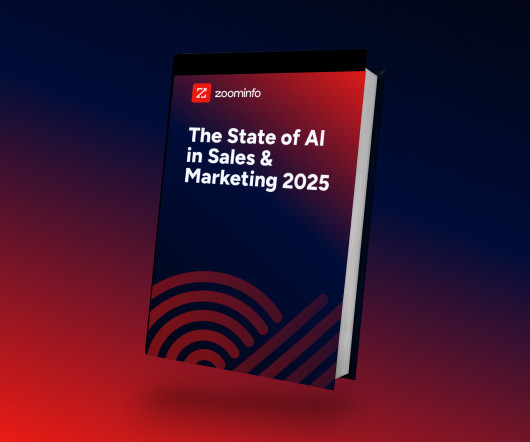
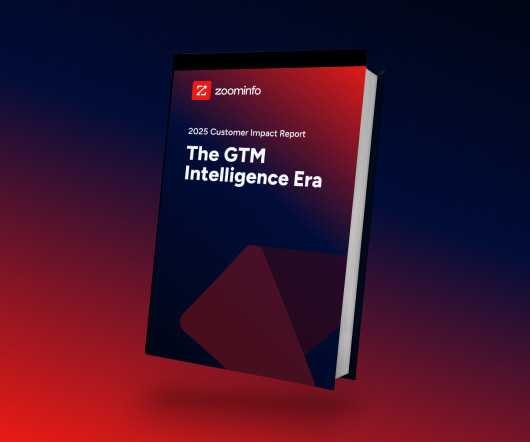
AI adoption is reshaping sales and marketing. But is it delivering real results? We surveyed 1,000+ GTM professionals to find out. The data is clear: AI users report 47% higher productivity and an average of 12 hours saved per week. But leaders say mainstream AI tools still fall short on accuracy and business impact. Download the full report today to see how AI is being used — and where go-to-market professionals think there are gaps and opportunities.
Overview Artificial Intelligence is a powerful tool capable of learning and executing various tasks Artificial Intelligence(AI) has the capacity to solve major global issues. The post 5 Pressing Global Issues AI is Solving appeared first on Analytics Vidhya.
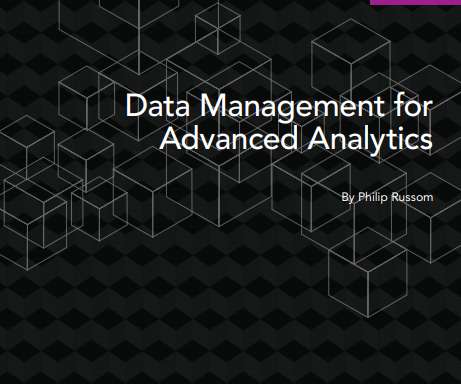
With the diversity of advanced analytics tools on the market, how do you know which data management solution will work for your organization? Truth is, you just need to find the right one for your particular advanced analytics solution. That’s why we are giving you access to the new report “Data Management for Advanced Analytics.”. Research firm Transforming Data with Intelligence (TDWI) reports on data management strategies and best practices as explained by practitioners in the field.
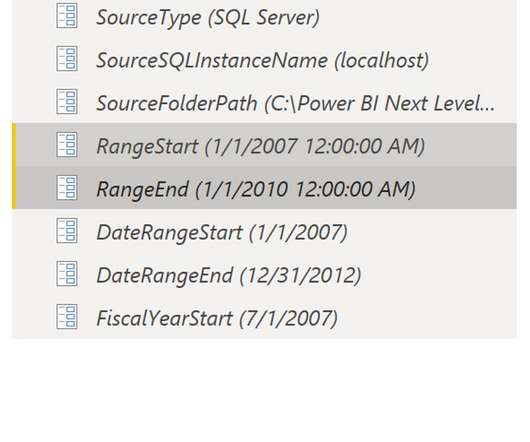
Second post in the "Doing Power BI the Right Way" series. In a business intelligence solution, data must be shaped and transformed. Your data is rarely, if ever, going to be in the right format for analytic reporting.
Second post in the "Doing Power BI the Right Way" series. In a business intelligence solution, data must be shaped and transformed. Your data is rarely, if ever, going to be in the right format for analytic reporting.
I’m thrilled to officially announce that registration is open for our first global conference as erwin, Inc. erwin Insights 2020 is a free, virtual, two-day event being held October 13-14. Social distancing doesn’t mean we should stop connecting. In fact, opportunities for personal and professional growth are more important than ever. That’s why we look forward to bringing together erwin’s global community of users, partners, prospects and friends to engage and explore ideas, experiences, trends
Introduction Setting up a development environment is not easy if you are inexperienced, especially if a lot of technologies you wish to learn are. The post Docker-based Python Development with CUDA Support on PyCharm and/or Visual Studio Code appeared first on Analytics Vidhya.
Customer Experience (CX) Leaders across Asia-Pacific have been stretched to capacity through recent market turbulence and shifting business priorities. In a world where five star customer experiences have never been more important, CX teams are often expected to prove the value of experience management, continuously advocate for funding, and overall, do more with less.
Speaker: Ben Epstein, Stealth Founder & CTO | Tony Karrer, Founder & CTO, Aggregage
When tasked with building a fundamentally new product line with deeper insights than previously achievable for a high-value client, Ben Epstein and his team faced a significant challenge: how to harness LLMs to produce consistent, high-accuracy outputs at scale. In this new session, Ben will share how he and his team engineered a system (based on proven software engineering approaches) that employs reproducible test variations (via temperature 0 and fixed seeds), and enables non-LLM evaluation m
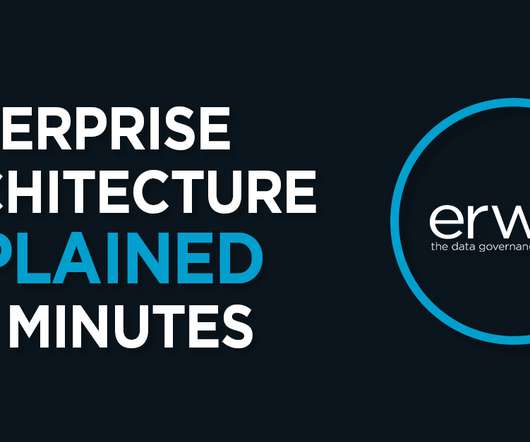
Enterprise architecture (EA) is a strategic planning initiative that helps align business and IT. It provides a visual blueprint, demonstrating the connection between applications, technologies and data to the business functions they support. In this post: What Is Enterprise Architecture? Think City Planning. Why Is Enterprise Architecture Important?
Introduction Recommendation systems are becoming increasingly important in today’s hectic world. People are always in the lookout for products/services that are best suited for. The post Movie Recommendation and Rating Prediction using K-Nearest Neighbors appeared first on Analytics Vidhya.
What is the truth regarding environmental issues and how much is made up? Will our human race, as we know it, come to an end if we don’t take dramatic actions? Is this just hype? Are the issues often overstated and not that cataclysmic? Below are some truths. Which ones do you think are true? […].
2020 may well go down as the year where what seems impossible today, did become possible tomorrow. It’s been a year filled with disruption and uncertainty. One day we were all going to the office, and the next we were working from home. Businesses had to literally switch operations, and enable better collaboration and access to data in an instant — while streamlining processes to accommodate a whole new way of doing things.
The DHS compliance audit clock is ticking on Zero Trust. Government agencies can no longer ignore or delay their Zero Trust initiatives. During this virtual panel discussion—featuring Kelly Fuller Gordon, Founder and CEO of RisX, Chris Wild, Zero Trust subject matter expert at Zermount, Inc., and Principal of Cybersecurity Practice at Eliassen Group, Trey Gannon—you’ll gain a detailed understanding of the Federal Zero Trust mandate, its requirements, milestones, and deadlines.
Blog. AI and machine learning are the future of every industry, especially data and analytics. In Growing Up with AI , we help you keep up with all the ways these pioneering technologies are changing the world. Reading through the Gartner Top 10 Trends in Data and Analytics for 2020 , I was struck by how different terms mean different things to different audiences under different contexts.
Overview We will discuss how you can query a MongoDB database using the PyMongo library. We will cover basic aggregation operations in MongoDB. The post Query a MongoDB Database using PyMongo! appeared first on Analytics Vidhya.
We are in the era of graphs. Graphs are hot. Why? Flexibility is one strong driver: heterogeneous data, integrating new data sources, and analytics all require flexibility. Graphs deliver it in spades. Over the last few years, a number of new graph databases came to market. As we start the next decade, dare we say […].
This blog post was originally published in October 2018 on Data From the Trenches. TL;DR : As data science evolves as a discipline, we think that it’s time to have a more systematic approach to feature engineering. That’s why we built EventsAggregator , an automatic feature engineering framework that leverages user’s knowledge to generate expressive features.
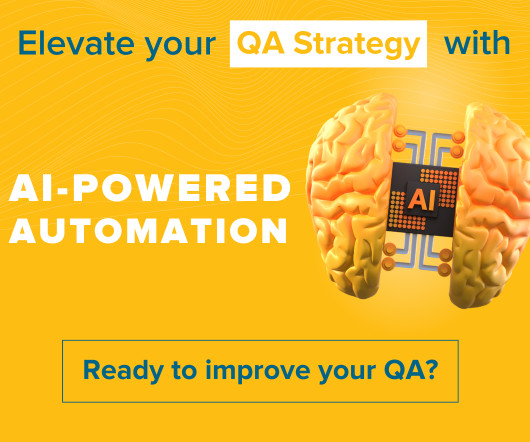
GAP's AI-Driven QA Accelerators revolutionize software testing by automating repetitive tasks and enhancing test coverage. From generating test cases and Cypress code to AI-powered code reviews and detailed defect reports, our platform streamlines QA processes, saving time and resources. Accelerate API testing with Pytest-based cases and boost accuracy while reducing human error.
Data warehousing is getting on in years. Concepts and architectures have been applied more or less unchanged since the 1990s. However, data warehousing and BI applications are only considered moderately successful. Users criticize their inadequate benefits, quality, efficiency and effectiveness. Especially in times of rapidly changing markets, decision-support systems should promote the quickest possible knowledge growth.
Introduction The human brain can easily recognize and distinguish the objects in an image. For instance, given the image of a cat and dog, The post Top 4 Pre-Trained Models for Image Classification with Python Code appeared first on Analytics Vidhya.
For years, I have been involved with estimating a wide variety of things. I have read about and then experimented with different estimation strategies. I have taught and coached others in estimation. I have worked with, and learned from, hundreds of people who also have a wide range of estimation experience. Throughout all this, I have identified […].
Edge computing is becoming a hot topic these days, and Dataiku is working hard to provide solutions to deploy models on all varieties of machines and environments. This article is for MLOps engineers who are looking for easy ways of deploying models in constrained environments. At the end of this article, readers will understand how they can deploy their models trained on Keras in DSS with ONNX runtime.
ZoomInfo customers aren’t just selling — they’re winning. Revenue teams using our Go-To-Market Intelligence platform grew pipeline by 32%, increased deal sizes by 40%, and booked 55% more meetings. Download this report to see what 11,000+ customers say about our Go-To-Market Intelligence platform and how it impacts their bottom line. The data speaks for itself!
Overview Get to know what the Monty Hall Problem is. Understand conditional probability with the use of Monty Hall Problem. Introduction I was. The post Understand Conditional Probability Solving the Monty Hall Problem! appeared first on Analytics Vidhya.
You may have used many tools that have some reporting function built-in. As your business grows, you’ll need complete reporting solutions to handle the fast-changing data and surging reports. Today, I will tell you how to develop reporting solutions that meet all relevant personnel’s needs in the reporting system. . Before start, let’s see what are reporting solutions, and what reporting solutions you should look for. .
In most organizations today, having someone with a title like “Head of AI” (much less CAIO) would be a running joke. Mostly because, well… there aren’t a lot of companies out there yet who are really doing AI. But also because in theory, AI is something that should be distributed and pervasive across a business, not confined to a certain department or role.
Many software teams have migrated their testing and production workloads to the cloud, yet development environments often remain tied to outdated local setups, limiting efficiency and growth. This is where Coder comes in. In our 101 Coder webinar, you’ll explore how cloud-based development environments can unlock new levels of productivity. Discover how to transition from local setups to a secure, cloud-powered ecosystem with ease.
Businesses across the globe have been forced to adapt their business models, technologies, and strategies to address the ongoing challenges of the COVID-19 pandemic. Business intelligence (BI) is no exception. Due to the public health concerns surrounding the coronavirus spread, companies of all kinds are being pushed into a remote work paradigm; a paradigm which many were unprepared for.
The COVID-19 pandemic has had far-reaching, profound effects on nearly every segment of the population. According to a new Pew Research Center survey , nearly nine in 10 U.S. adults say their life has changed at least a little as a result of the outbreak, including 44% who say their life has changed in a major way. The same can be said for American business: the coronavirus pandemic has forced digital transformation and remote work on organizations whether they were ready or not.
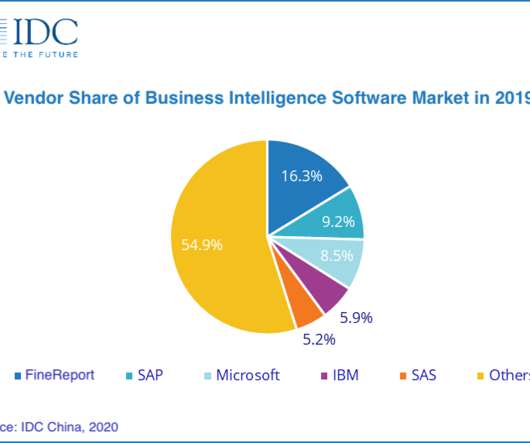
According to “IDC Semiannual Software Tracker for the Second Half of 2019”, the scale of China’s business intelligence software market reached US$490 million in 2019, with a year-on-year increase of 22.6%. And IDC predicts that the growth rate of China’s BI software market will slow down in 2020 due to the impact of the COVID-19 outbreak, with a year-on-year growth of 18.1%.
What is a Finance Department and Manager Level KPI? A finance department Key Performance Indicator (KPI) or metric is a clearly defined quantifiable measure used to evaluate a company’s financial performance. From an external perspective, investors compare the financial KPIs of different companies to determine which is a better investment. Internally, companies use financial metrics to evaluate prospective investments and track internal performance from a financial perspective.
Large enterprises face unique challenges in optimizing their Business Intelligence (BI) output due to the sheer scale and complexity of their operations. Unlike smaller organizations, where basic BI features and simple dashboards might suffice, enterprises must manage vast amounts of data from diverse sources. What are the top modern BI use cases for enterprise businesses to help you get a leg up on the competition?
We organize all of the trending information in your field so you don't have to. Join 42,000+ users and stay up to date on the latest articles your peers are reading.
You know about us, now we want to get to know you!
Let's personalize your content
Let's get even more personalized
We recognize your account from another site in our network, please click 'Send Email' below to continue with verifying your account and setting a password.


Let's personalize your content