This site uses cookies to improve your experience. To help us insure we adhere to various privacy regulations, please select your country/region of residence. If you do not select a country, we will assume you are from the United States. Select your Cookie Settings or view our Privacy Policy and Terms of Use.
Cookie Settings
Cookies and similar technologies are used on this website for proper function of the website, for tracking performance analytics and for marketing purposes. We and some of our third-party providers may use cookie data for various purposes. Please review the cookie settings below and choose your preference.
Used for the proper function of the website
Used for monitoring website traffic and interactions
Cookie Settings
Cookies and similar technologies are used on this website for proper function of the website, for tracking performance analytics and for marketing purposes. We and some of our third-party providers may use cookie data for various purposes. Please review the cookie settings below and choose your preference.
Strictly Necessary: Used for the proper function of the website
Performance/Analytics: Used for monitoring website traffic and interactions
Ahead of his appearance at this year’s Chief Data & Analytics Officer Africa conference, Michiel van Staden, Data Analytics Lead: Everyday Banking Growth at Absa, shares three things his experiences to date have taught him about data leadership. The value of data analytics rests on communication.
This blog post is part of a series of guest publications by Excelion Partners. It’s been growing for years. The rift just keeps getting bigger. There is plenty of blame to go around. Failed projects. Poor requirements. Scope creep. Software product marketing overpromising. Order taking and lack of progress.
The Challenge of Making Machines Understand Text Language is a wonderful medium of communication. You and I would have understood that sentence in a. The post Quick Introduction to Bag-of-Words (BoW) and TF-IDF for Creating Features from Text appeared first on Analytics Vidhya.
AI adoption is reshaping sales and marketing. But is it delivering real results? We surveyed 1,000+ GTM professionals to find out. The data is clear: AI users report 47% higher productivity and an average of 12 hours saved per week. But leaders say mainstream AI tools still fall short on accuracy and business impact. Download the full report today to see how AI is being used — and where go-to-market professionals think there are gaps and opportunities.
With customers increasingly demanding fast, convenient insurance quotes, the industry’s data leaders are feeling the pressure to develop products, services and experiences fit for the modern age. AI-driven insurance app Lemonade is the latest in a long line of financial services innovations designed to put customer experiences first.
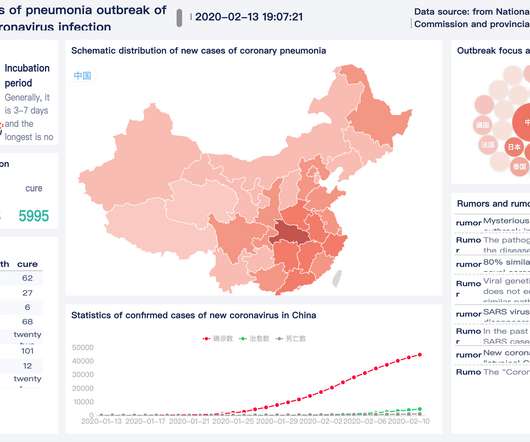
The Coronavirus has infected nearly 80,000 people worldwide, resulting in some 2,500 fatalities. As this deadly contagion continues spreading from its origins in Wuhan, China, policymakers worldwide are scrambling to figure out how to contain it.
Data Science 101 is honored to present the Global Women in Data Science 2020 livestream. This is the fifth annual global conference which features “outstanding women doing outstanding data science work in academia, industry, government, and non-profits.” The livestream is free and it begins March 2, 2020 at 9am PST. The livestream will be available during the live event.
Data Science 101 is honored to present the Global Women in Data Science 2020 livestream. This is the fifth annual global conference which features “outstanding women doing outstanding data science work in academia, industry, government, and non-profits.” The livestream is free and it begins March 2, 2020 at 9am PST. The livestream will be available during the live event.
Introduction SQL Joins can be a tricky concept to master for beginners. If you haven’t studied programming before, you might struggle to make sense. The post Understanding Joins In SQL – Inner, Left, Right and Full Joins Explained appeared first on Analytics Vidhya.
Making good decisions is hard. And often, it’s the process that’s behind your decision that needs the most help. How you develop judgment and good decision making habits matters. That’s why I’ve been looking around for simple tools that help better “decisioning” become a habit.
HIMSS20 is around the corner and, like most, I am contemplating the conversations I will have there and am reflecting on the impact of AI on the future of healthcare.
The novel coronavirus (now officially named COVID-19), first discovered in the city of Wuhan, China has infected over 59,000 Chinese citizens and killed more than 1,000 in the past six weeks. In addition to speeding up virus vaccine research and strengthening personnel mobility management, the timely collection, transmission, and management of personnel information has also become a vital part of this battle against the virus.
Speaker: Ben Epstein, Stealth Founder & CTO | Tony Karrer, Founder & CTO, Aggregage
When tasked with building a fundamentally new product line with deeper insights than previously achievable for a high-value client, Ben Epstein and his team faced a significant challenge: how to harness LLMs to produce consistent, high-accuracy outputs at scale. In this new session, Ben will share how he and his team engineered a system (based on proven software engineering approaches) that employs reproducible test variations (via temperature 0 and fixed seeds), and enables non-LLM evaluation m
Distance metrics are a key part of several machine learning algorithms. These distance metrics are used in both supervised and unsupervised learning, generally to. The post 4 Types of Distance Metrics in Machine Learning appeared first on Analytics Vidhya.
Welcome to Cloud Data Science 8. This weeks news includes information about AWS working with Azure, time-series, detecting text in videos and more. News. Amazon Redshift now supports Authentication with Microsoft Azure AD Redshift, a data warehouse, from Amazon now integrates with Azure Active Directory for login. This continues a trend of cloud companies working together.
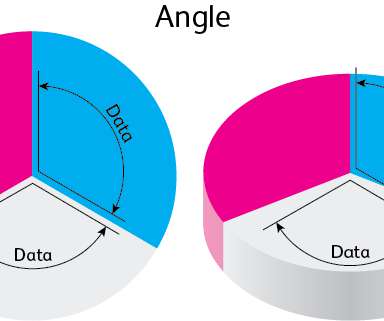
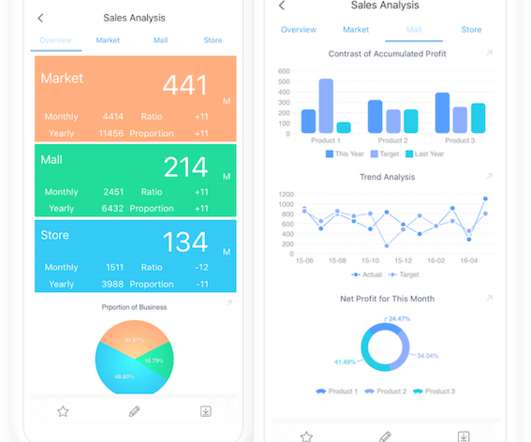
In the process of making charts, we will inevitably encounter various problems. What data visualization mistakes should we avoid to make a proper chart? People who like data visualization, it is really difficult to make a good chart, and it is not easy to make a chart without making mistakes. The purpose of the chart is to provide an easier and faster understanding of shortcuts.
The DHS compliance audit clock is ticking on Zero Trust. Government agencies can no longer ignore or delay their Zero Trust initiatives. During this virtual panel discussion—featuring Kelly Fuller Gordon, Founder and CEO of RisX, Chris Wild, Zero Trust subject matter expert at Zermount, Inc., and Principal of Cybersecurity Practice at Eliassen Group, Trey Gannon—you’ll gain a detailed understanding of the Federal Zero Trust mandate, its requirements, milestones, and deadlines.
matplotlib – The Most Popular Python Library for Data Visualization and Exploration I love working with matplotlib in Python. It was the first visualization. The post A Beginner’s Guide to matplotlib for Data Visualization and Exploration in Python appeared first on Analytics Vidhya.
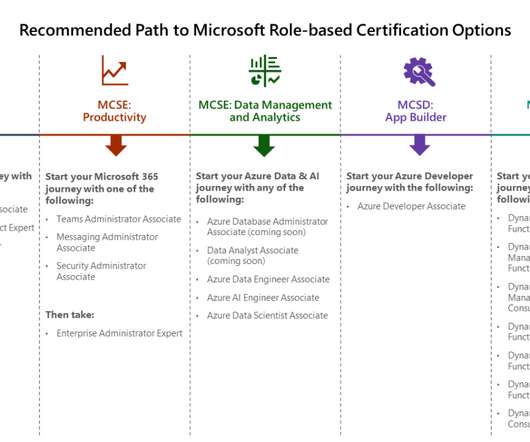
Microsoft has just announced the end of some long standing certifications. The following Microsoft certifications are set to retire in 2020. Microsoft Certified Solutions Associate (MCSA) Microsoft Certified Solutions Expert (MCSE) Microsoft Certified Solutions Developer (MCSD). In addition to the certifications going away, the related exams will also be retired.
Artificial Intelligence (AI) is no longer in its infancy; it is an essential business transformation tool to deliver results with impact. AI is changing every aspect of business by bringing data to the center: from AI infused customer and employee experiences to AI infused operations, and, ultimately, protecting the company from external risks and fraud. .
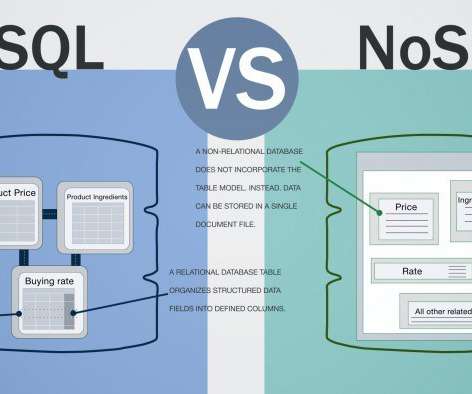
1. What is database reporting tools? Database reporting tools are the reporting software that helps you directly generate reports of the data from the database or the data warehouse you use. There are two types of databases used in the company or organizations: relational databases and NoSQL data sources. . From Google. The relational database is built on the relational model.
GAP's AI-Driven QA Accelerators revolutionize software testing by automating repetitive tasks and enhancing test coverage. From generating test cases and Cypress code to AI-powered code reviews and detailed defect reports, our platform streamlines QA processes, saving time and resources. Accelerate API testing with Pytest-based cases and boost accuracy while reducing human error.
Introduction to Joins in Pandas “I have two different tables in Python but I’m not sure how to join them. What criteria should I. The post Joins in Pandas: Master the Different Types of Joins in Python appeared first on Analytics Vidhya.
Blog. In Transform to Win , we explore the challenges facing modern companies, diving into their individual digital transformations and the people who drive them. Learn about the changes they’re making to not just remain competitive, but win in the future to stand the test of time. We all know that data is becoming more and more essential for businesses, as the volume of data keeps growing.
1. What Is Enterprise Reporting? Enterprise reporting is a process of extracting, processing, organizing, analyzing, and displaying data in the companies. It uses enterprise reporting tools to organize data into charts, tables, widgets, or other visualizations. It may offer a range of interactivity, so users can find business problems and make data-driven decisions via the reports.
ZoomInfo customers aren’t just selling — they’re winning. Revenue teams using our Go-To-Market Intelligence platform grew pipeline by 32%, increased deal sizes by 40%, and booked 55% more meetings. Download this report to see what 11,000+ customers say about our Go-To-Market Intelligence platform and how it impacts their bottom line. The data speaks for itself!
Did you know that ‘Data Engineer’ is the fastest-growing role in the industry? Currently, most data science aspirants are still focused on landing the. The post 9 Books Every Data Engineering Aspirant Must Read! appeared first on Analytics Vidhya.
This story is part of Analytics Heroes, a series of profiles on leaders transforming business analytics. Perched on a stool and going over his notes, Matt Newman prepares for an on-camera interview at Data and AI Forum in Miami, Florida. Matt is the Senior Financial Systems Manager at Sunbelt Rentals, the second-largest heavy equipment rental company in North America.
Data collection is nothing new, but the introduction of mobile devices has made it more interesting and efficient. Before the advent of mobile technology, we needed to use pen and paper to record information on the spot, or manually enter it into a computer to organize the information. But now, mobile data collection means information can be digitally recording on the mobile device at the source of its origin, eliminating the need for data entry after the information is collected.
Many software teams have migrated their testing and production workloads to the cloud, yet development environments often remain tied to outdated local setups, limiting efficiency and growth. This is where Coder comes in. In our 101 Coder webinar, you’ll explore how cloud-based development environments can unlock new levels of productivity. Discover how to transition from local setups to a secure, cloud-powered ecosystem with ease.
Overview What is sports analytics? What are the different use cases of sports analytics? We answer these questions here Understand how sports analytics can. The post Sports Analytics – Generating Actionable Insights using Cricket Commentary appeared first on Analytics Vidhya.
Digital transformation could mean different things to different businesses. Case in point, banks. Let’s start with 2 news items that show how banks are transforming, digitally and literally: News 1: HSBC: HSBC Moves $20 Billion From Paper to Blockchain In One Of The Biggest Financial Deployments. The bank is taking this move to digitize paper-based records of private placements with a Digital Vault that can give real-time access to securities records.
XGBoost is one of the most used libraries fora data science. At the time XGBoost came into existence, it was lightning fast compared to its nearest rival Python’s Scikit-learn GBM. But as the times have progressed, it has been rivaled by some awesome libraries like LightGBM and Catboost, both on speed as well as accuracy. I, for one, use LightGBM for most of the use cases where I have just got CPU for training.
Blog. Developing analytic apps is a bold new direction for product teams. The Toolbox is where we talk development best practices, tips, tricks, and success stories to help you build the future of analytics and empower your users with the insights and actions they need. What is the ultimate goal of using data internally at your organization? You probably answered something like “Make smarter, data-driven decisions.
Large enterprises face unique challenges in optimizing their Business Intelligence (BI) output due to the sheer scale and complexity of their operations. Unlike smaller organizations, where basic BI features and simple dashboards might suffice, enterprises must manage vast amounts of data from diverse sources. What are the top modern BI use cases for enterprise businesses to help you get a leg up on the competition?
We organize all of the trending information in your field so you don't have to. Join 42,000+ users and stay up to date on the latest articles your peers are reading.
You know about us, now we want to get to know you!
Let's personalize your content
Let's get even more personalized
We recognize your account from another site in our network, please click 'Send Email' below to continue with verifying your account and setting a password.


Let's personalize your content