This site uses cookies to improve your experience. To help us insure we adhere to various privacy regulations, please select your country/region of residence. If you do not select a country, we will assume you are from the United States. Select your Cookie Settings or view our Privacy Policy and Terms of Use.
Cookie Settings
Cookies and similar technologies are used on this website for proper function of the website, for tracking performance analytics and for marketing purposes. We and some of our third-party providers may use cookie data for various purposes. Please review the cookie settings below and choose your preference.
Used for the proper function of the website
Used for monitoring website traffic and interactions
Cookie Settings
Cookies and similar technologies are used on this website for proper function of the website, for tracking performance analytics and for marketing purposes. We and some of our third-party providers may use cookie data for various purposes. Please review the cookie settings below and choose your preference.
Strictly Necessary: Used for the proper function of the website
Performance/Analytics: Used for monitoring website traffic and interactions
'I'm excited about the power of a well created dashboard. It is a thing of beauty and a source of immense joy. Oh, and of course a critical element for any company's path to glory. Dashboards are every where, we will look at a lot of them in this post and they are all digital. So let's start with one that you might not typically bump into.
The poor, maligned 3D pie chart. He is so popular among the common folk, but put him next to his peers and his vacant stare betrays (not entirely unfounded) feelings of insecurity and inadequacy. Sometimes the only way to address such feelings is to let go of your inhibitions and do something unexpected. He has value hidden away, we're sure of it. And so, for the third installment in our Data Looks Better Naked series, we are recommending that the 3D pie do what the bar chart and table have done
Imagine you just started a job at a new company. You watched World War Z recently, so you're in a skeptical mood, and given that your last two startups failed from what you believe to be a lack of data, you're giving everything an extra critical eye. You start by thinking about the impact of the sales team. How much extra revenue are they generating for the company?
I recently had an assignment to build a prototype for one of my clients, which involved in setting up KPIs. I then had a talk with a couple of people in my network to discuss how one could setup dynamic KPI thresholds. Narius Patel came up with a great idea of representing KPI status with image and using separate table to store the threshold values.
AI adoption is reshaping sales and marketing. But is it delivering real results? We surveyed 1,000+ GTM professionals to find out. The data is clear: AI users report 47% higher productivity and an average of 12 hours saved per week. But leaders say mainstream AI tools still fall short on accuracy and business impact. Download the full report today to see how AI is being used — and where go-to-market professionals think there are gaps and opportunities.
I don’t like making predictions, so rest assured this is not another of a myriad of predictions articles that hit the media annually. Instead, let’s kick start the year with some definite plans and aspirations of companies in the business intelligence sphere. A great place for an insightful, real-world view of BI trends is my weekly #BIWisdom tweetchats with BI customers, vendors and consultants.
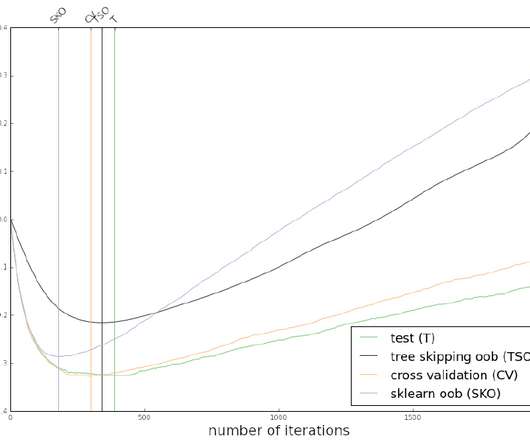
In my summary of the Kaggle bulldozer price forecasting competition, I mentioned that part of my solution was based on stochastic gradient boosting. To reduce runtime, the number of boosting iterations was set by minimising the loss on the out-of-bag (OOB) samples, skipping trees where samples are in-bag. This approach was motivated by a bug in scikit-learn, where the OOB loss estimate was calculated on the in-bag samples, meaning that it always improved (and thus was useless for the purpose of
As I start some preparatory work for 2015 initiatives, I have noticed that many analytics vendors are starting to shift their views of SMBs and the needs of midmarket companies in general. When solution providers first started developing their market strategy and developing analytics related solutions for SMBs, their products took similar shape. They were less expensive, less robust, with a smaller number of relevant capabilities.
As I start some preparatory work for 2015 initiatives, I have noticed that many analytics vendors are starting to shift their views of SMBs and the needs of midmarket companies in general. When solution providers first started developing their market strategy and developing analytics related solutions for SMBs, their products took similar shape. They were less expensive, less robust, with a smaller number of relevant capabilities.
In online advertising, click-through rate (CTR) is a very important metric for evaluating ad performance. As a result, click prediction systems are essential and widely used for sponsored search and real-time bidding. For this competition, we have provided 11 days worth of Avazu data to build and test prediction models. Can you find a strategy that beats standard classification algorithms?
Big data – the Holy Grail of business intelligence (BI)? Big data technologies certainly hold the promise of closing the gap between the data that’s available in your organization, and the ability to make that data available to those who need it, when they need it. But it’s about more than just technology: you also […].
Customer analytics takes center stage in the age of the customer for firms trying to understand and predict customer behavior. From descriptive to predictive methods, customer insights (CI) professionals can apply a wide array of analytics methods to behavioral customer data. CI professionals have a lot to consider when deciding on the right portfolio of […].
Speaker: Ben Epstein, Stealth Founder & CTO | Tony Karrer, Founder & CTO, Aggregage
When tasked with building a fundamentally new product line with deeper insights than previously achievable for a high-value client, Ben Epstein and his team faced a significant challenge: how to harness LLMs to produce consistent, high-accuracy outputs at scale. In this new session, Ben will share how he and his team engineered a system (based on proven software engineering approaches) that employs reproducible test variations (via temperature 0 and fixed seeds), and enables non-LLM evaluation m
'There is unlimited amount of data thrown off our digital existences. (Or to use sexy term du jour , we have big data!). Our leaders (companies, agencies, teams) have to deal with an incredibly complex landscape, and they don't have enough time. The very natural outcomes is this ask of us: "Can you make it simple? What's the one thing I should care about?
We've done a few critique/redesigns of graphics on the site, but now its time to shine that sometimes unflattering light back on ourselves. While going through some materials I came across a graphic much like this one. The chart is clean, with axes lightened so the data is in the foreground, and the series direct labelled. Unfortunately it is not very effective at conveying much beyond "There is lots of pillaging.
I love studying users and products, and think data science can be extremely useful in guiding product/strategy as a whole. So I thought it would be fun to depart from the usual machine learning and engineering things I write about, and do a quick study of Airbnb. Think of this like business analysis, or strategy – from a data science point of view. (It's in slide deck form , of course, because that's how these things roll.).
It is Christmas Eve here in Australia now! Wow! I’d like to say thank you to all my readers, my twitter followers and most of all #SQLFamily (whom quite a few of them are now becoming my absolutely dear friends). This year has been truly a blast! Thank you for being part of my SQL and Data/BI journey. All the best and here’s something that I put together (last minute) using Power Map.
The DHS compliance audit clock is ticking on Zero Trust. Government agencies can no longer ignore or delay their Zero Trust initiatives. During this virtual panel discussion—featuring Kelly Fuller Gordon, Founder and CEO of RisX, Chris Wild, Zero Trust subject matter expert at Zermount, Inc., and Principal of Cybersecurity Practice at Eliassen Group, Trey Gannon—you’ll gain a detailed understanding of the Federal Zero Trust mandate, its requirements, milestones, and deadlines.
November 2, 2014 It happened so fast …. With one foot in the trap, it looked like he had utterly failed in his mission. … It all started nineteen years earlier when …. Everyone likes a good story. Especially marketing teams in today’s leading businesses. They know that effective storytelling enhances brand and knocks down barriers to sales. Similarly, it’s becoming a powerful way to distribute data and information in business intelligence initiatives.
In previous posts about getting traction for my Bandcamp recommendations project (BCRecommender), I mentioned search engine optimisation (SEO) as one of the promising traction channels. Unfortunately, early efforts yielded negligible traffic – most new visitors came from referrals from blogs and Twitter. It turns out that the problem was not showing up for the SEO game: most of BCRecommender’s pages were blocked for crawling via robots.txt because I was worried that search engines (=Google
As BI use matures within the organization, the way in which it is being applied is also changing. Organizations are looking for more strategic ways to deliver analytical insight and make sure that the right people have direct access to the information they need. Part of this includes the increasing adoption of embedding analytics within operations. At the same time, organizations are taking advantage of embedded BI to provide customer facing analytics and added services by leveraging the data th
This is a simple illustration of using Pattern Module to scrape web data using Python. We will be scraping the data from imdb for the top TV Series along with their ratings We will be using this link for this: [link] This URL gives a list of top Rated TV Series which have number of votes atleast 5000. The Thing to note in this URL is the “&start=” parameter where we can specify which review should the list begin with.
GAP's AI-Driven QA Accelerators revolutionize software testing by automating repetitive tasks and enhancing test coverage. From generating test cases and Cypress code to AI-powered code reviews and detailed defect reports, our platform streamlines QA processes, saving time and resources. Accelerate API testing with Pytest-based cases and boost accuracy while reducing human error.
'In a world of infinite choice, the ability to pick critical few metrics to focus on is, well…, critical. It is the difference between plodding along, or winning big. But choosing what to focus on is extremely hard. You have to have a deeper understanding of the business, an expansive knowledge of what is possible (and not just inside Google/Adobe Analytics), and, this is so, so, so important, the ability to balance the now and the near future.
'We have more data than God wants anyone to have. We have more talent deployed than was ever true in history. We have more money being pumped into our ecosystem than ever before. We have our senior leadership involved like never before. Yet the end result of all that is so far away from where it should be. We definitely stink less in most cases. But with all this data, talent, money and leadership support, we are not knocking the ball out of the park.
'YouTube is magnificent. YouTube is amazing. YouTube is… wait, let me quantify that. YouTube Marketing and Analytics Framework for Success. According to Nielsen, YouTube reaches more US adults ages 18-34 than any cable network as of mid-2013. And rather than just being content you watch, it is content you watch, share and shape. How cool is that!
'My last post, perhaps provocatively, called for a reduction of data in executive dashboards (digital, online, offline). More English (IABI, specifically) would lead to a smarter understanding of performance, and of course glory for data practitioners. Here's the post: Strategic & Tactical Dashboards: Best Practices, Examples. In the post Adil commented that he's observed that attribution modeling is missing from most web analytics dashboards.
Many software teams have migrated their testing and production workloads to the cloud, yet development environments often remain tied to outdated local setups, limiting efficiency and growth. This is where Coder comes in. In our 101 Coder webinar, you’ll explore how cloud-based development environments can unlock new levels of productivity. Discover how to transition from local setups to a secure, cloud-powered ecosystem with ease.
'Like a vast majority on planet Earth, I love data visualizations. Ok, so perhaps as the author of two bestselling books on analytics I love it a little bit more! There is something magical about taking an incredible amount of complexity and presenting it as simply as we possibly can with the goal of letting the cogently presented insight drive action.
'There are three elements to our "big data" efforts, or unhyped normal data efforts: Data Collection, Data Reporting, and Data Analysis. (More on that here: DC-DR-DA: A Simple Framework For Smarter Decisions.). We are all aware that the best companies in the world have an optimal DC-DR-DA allocation when it comes to time/money/people: 15%-20%-65%.
'Nothing I can tell you about the importance of having an incredible mobile strategy will surprise you. Mobile devices (phones, tablets, wearables) are transforming how we behave, how we buy, how we consume content, and dare I say how we become happy or we become sad. You after all have all of the aforementioned devices, and it is likely that at some level you are looking at traffic to your company's digital existence.
'Every indicator we have is that companies are investing more in every facet of analytics. Tools. People. Consulting. Processes. Yet, it is unclear if that increase in investment is being followed by a commensurate increase in value delivered to the organization's bottom-line. A part of reason for this mis-match in value delivered is that there is a natural evolution that needs to occur.
Large enterprises face unique challenges in optimizing their Business Intelligence (BI) output due to the sheer scale and complexity of their operations. Unlike smaller organizations, where basic BI features and simple dashboards might suffice, enterprises must manage vast amounts of data from diverse sources. What are the top modern BI use cases for enterprise businesses to help you get a leg up on the competition?
'Every once in a while I take a pause and answer your questions, your burning questions (!), about digital marketing and analytics. I'd requested you to submit questions on my Facebook or Google+ pages and am always delighted at the wide range of challenges you share. For some answers, What is Avinash's typical day like? Hour-by-hour report please. :)?
Messy data, buggy software, but all in all a good learning experience. Early last year, I had some free time on my hands, so I decided to participate in yet another Kaggle competition. Having never done any price forecasting work before, I thought it would be interesting to work on the Blue Book for Bulldozers competition, where the goal was to predict the sale price of auctioned bulldozers.
This is the fifth part of a series of posts on my Bandcamp recommendations (BCRecommender) project. Check out previous posts on the general motivation behind this project, the system’s architecture, the recommendation algorithms, and initial traction planning. In a previous post, I discussed my plans to apply the Bullseye framework from the Traction Book to BCRecommender, my Bandcamp recommendations project.
A few months ago I participated in the Kaggle Greek Media Monitoring competition. The goal of the competition was doing multilabel classification of texts scanned from Greek print media. Despite not having much time due to travelling and other commitments, I managed to finish 6th (out of 120 teams). This post describes my approach to the problem. Data & evaluation The data consists of articles scanned from Greek print media in May-September 2013.
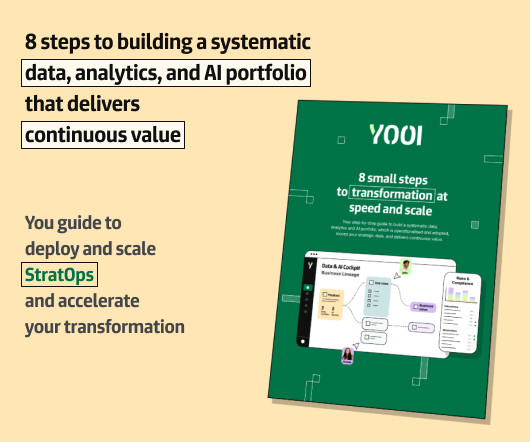
📌Is your Data & AI transformation struggling to really impact the business? Discover the game-changing StratOps approach that: Bridges the Gap : Connect your Data & AI strategy to your operating model, to ensure alignment at every level. Prioritizes Outcomes : Focuses on concrete business outcomes from day one, rather than capabilities in isolation.
We organize all of the trending information in your field so you don't have to. Join 42,000+ users and stay up to date on the latest articles your peers are reading.
You know about us, now we want to get to know you!
Let's personalize your content
Let's get even more personalized
We recognize your account from another site in our network, please click 'Send Email' below to continue with verifying your account and setting a password.


Let's personalize your content