This site uses cookies to improve your experience. To help us insure we adhere to various privacy regulations, please select your country/region of residence. If you do not select a country, we will assume you are from the United States. Select your Cookie Settings or view our Privacy Policy and Terms of Use.
Cookie Settings
Cookies and similar technologies are used on this website for proper function of the website, for tracking performance analytics and for marketing purposes. We and some of our third-party providers may use cookie data for various purposes. Please review the cookie settings below and choose your preference.
Used for the proper function of the website
Used for monitoring website traffic and interactions
Cookie Settings
Cookies and similar technologies are used on this website for proper function of the website, for tracking performance analytics and for marketing purposes. We and some of our third-party providers may use cookie data for various purposes. Please review the cookie settings below and choose your preference.
Strictly Necessary: Used for the proper function of the website
Performance/Analytics: Used for monitoring website traffic and interactions
There is one difference between winners and losers when it comes to web analytics. Winners, well before they think data or tool, have a well structured Digital Marketing & Measurement Model. Losers don't. This article guides you in understanding the value of the Digital Marketing & Measurement Model (notice the repeated emphasis on Marketing, not just Measurement), and how to create one for yourself.
How do you know what machine learning algorithm to choose for your classification problem? Of course, if you really care about accuracy, your best bet is to test out a couple different ones (making sure to try different parameters within each algorithm as well), and select the best one by cross-validation. But if you’re simply looking for a “good enough” algorithm for your problem, or a place to start, here are some general guidelines I’ve found to work well over the year
Question: What do Cloud Computing, pervasive mobility, and TV white space have to do with each other? Answer: Read this blog post and find out! Virtually every customer conversation that I have these days is centered on the topic of mobility. Enterprise users want to communicate and collaborate anytime, anywhere, using any device. Most of my conversations focus on mobile device management, information security, and application architecture.
AI adoption is reshaping sales and marketing. But is it delivering real results? We surveyed 1,000+ GTM professionals to find out. The data is clear: AI users report 47% higher productivity and an average of 12 hours saved per week. But leaders say mainstream AI tools still fall short on accuracy and business impact. Download the full report today to see how AI is being used — and where go-to-market professionals think there are gaps and opportunities.
I am going to break one of my unspoken cardinal rules: Only write about real problems and measurement that is actually possible in the real world. I am going to break the second part of the rule. I am going to define a way for you to think about measuring social media, and you can't actually easily measure what I am going to recommend. [Update: Please see update #2 below, you can now easily measure what's recommended in this post.].
We have access to more data than God wants anyone to have. Thus it is not surprising that we feel overwhelmed, and rather than being data driven we just get paralyzed. Life does not have to be that scary. In fact a data driven life is sexiest digital life you can imagine. In this blog post we are going to bring the sexyback. I am going to attempt to significantly simply your life by recommending the critical few metrics you should use to analyze performance of your digital marketing campaigns an
With all the sexiness oozing out of social media it might seem insane to write about email. It’s been relegated to the “OMG that cesspool of spam that no one cares about because everyone is using Google Wave and Facebook!”. Not true. Email remains an immensely credible and profitable channel, with an immense reach to boot. To not have it as an active part of your marketing portfolio is sub-optimal.
With all the sexiness oozing out of social media it might seem insane to write about email. It’s been relegated to the “OMG that cesspool of spam that no one cares about because everyone is using Google Wave and Facebook!”. Not true. Email remains an immensely credible and profitable channel, with an immense reach to boot. To not have it as an active part of your marketing portfolio is sub-optimal.
It is astonishingly common that we are asked to analyze the impossible. In perhaps a career-limiting move I'm going to try to do that today (and for a controversial topic to boot!). In this post about an important Google change, I want you to focus less on the data and focus more on the methodology. And – so important – I want you to help me with your ideas of how we can do this impossible analysis better, in the complete absence of data :).
Data analysis is not easy. It takes years to get good at it, and once you get good at it you realize how much more there is to learn. That is part of the joy. You are always learning. You are always growing. This blogpost is a collection of tips I share with my friends who are just starting out. Each tip is a "simple" mistake that is easily avoided.
Recently the Google Analytics team changed the way sessionization algorithm. In lay terms… how the start, duration and end of a Visit is computed. A minor version of the butterfly effect occurred, one small change in a part of the system caused a few other smaller changes in other parts of the system. Some people freaked out. Others wondered what the fuss was all about.
Someone asked me this very simple question today. What's the difference between web reporting and web analysis? My instinct was to use the wry observation uttered by US Supreme Court Justice Potter Stewart in trying to define po rn: " I know it when I see it. " That applies to what is analysis. I know it when I see it. : ). That, of course, would have been an unhelpful answer.
Speaker: Ben Epstein, Stealth Founder & CTO | Tony Karrer, Founder & CTO, Aggregage
When tasked with building a fundamentally new product line with deeper insights than previously achievable for a high-value client, Ben Epstein and his team faced a significant challenge: how to harness LLMs to produce consistent, high-accuracy outputs at scale. In this new session, Ben will share how he and his team engineered a system (based on proven software engineering approaches) that employs reproducible test variations (via temperature 0 and fixed seeds), and enables non-LLM evaluation m
Every presentation I do is customized for the audience in the room. That means I get to spend loads and loads of time across many industry verticals, see many many campaigns, translate many many foreign websites (thanks Google Chrome for auto-translate!) and meet many many many executives and hear about their digital marketing strategies, challenges and outcomes.
Web Analysts are blessed with an immense amount of data, and an amazing amount of valuable, even sexy, metrics to understand business performance. Yet our heroic efforts to report the aforementioned sexy metrics lead to little business action. Why? Sure your organization could be to blame ( org structure, bad boss , ineffectual team ). Perhaps your client did not provide you with the all important Web Analytics Measurement Model.
I got an email the other day with this simple question: "How do break into the world of web analytics?" Actually I get that question almost every single day. :). The interest is not surprising. There is a ton of excitement about web analytics. Companies are starting to think innovatively about the web (no more unintelligent banner ads or digital "crimes against humanity" ), and they are starting to understand the power of data to delight customers and drive accountability.
Here you'll find all my blog posts categorized into a structure that will hopefully make it easy for you to discover new content, find answers to your questions, or simply wallow in some excellent analytics narratives. To assist with that process everything's organized into these sections: ~ Digital Marketing: "What is amazing out there?
The DHS compliance audit clock is ticking on Zero Trust. Government agencies can no longer ignore or delay their Zero Trust initiatives. During this virtual panel discussion—featuring Kelly Fuller Gordon, Founder and CEO of RisX, Chris Wild, Zero Trust subject matter expert at Zermount, Inc., and Principal of Cybersecurity Practice at Eliassen Group, Trey Gannon—you’ll gain a detailed understanding of the Federal Zero Trust mandate, its requirements, milestones, and deadlines.
99.9996253% of Web Analytics reports produced are utterly useless. Partly because of a lack of any tie to business strategy (ensure you have a Digital Marketing & Measurement Model !), partly because they are out of the box standard reports that web analytics vendors create for “average” people (and we both know that you are not average!), and partly because all they do is present data in the aggregate (a punishable criminal offence if there ever was one!).
Regular readers of this blog will recognize that I suffer from OOD. Outcomes Obsession Disorder. I am seeing a therapist for it. The way OOD manifests itself is that in every website and web business I work with I am obnoxiously persistent in helping identify the desired outcomes of the site / business before I ever log into their web analytics data.
Let's start off the new year with lessons learned from a tough life on the front lines of trying to make the world a smidgen more data-driven. This post is a collection of six things I wish I knew before I started my career in decision support systems (of which web analytics is just the latest incarnation). These lessons might have made some goals easier to accomplish, some frustrations easier to avoid and some salary jumps easier to come by.
With a plethora of digital media channels at our disposal and new ones on the way every day(!), how do you prioritize your efforts? How do you figure out which channels to invest in more and which to kill? How do you figure out if you are spending more money reaching the exact same current or prospective customers multiple times? How do you get over the frustration of having done attribution modeling and realizing that it is not even remotely the solution to your challenge of using multiple medi
GAP's AI-Driven QA Accelerators revolutionize software testing by automating repetitive tasks and enhancing test coverage. From generating test cases and Cypress code to AI-powered code reviews and detailed defect reports, our platform streamlines QA processes, saving time and resources. Accelerate API testing with Pytest-based cases and boost accuracy while reducing human error.
Just when you thought you were finally getting more comfortable with website analytics and the metrics you report, here comes the massive explosion of mobile data! At one level it is the normal impressions and clicks data, but on another level we are getting new data and metrics we normally don't use. We are going to have fun doing cool stuff, learning new things.
My beloved little labor of love, this analytics blog, is 5 years old today. Five! I am so proud of having reached this incredible milestone, because when I started I was not sure I would make it to the first anniversary. Let me tell you how utterly improbable it seemed. My first blog post, on May 15th, 2006, was titled Traditional Web Analytics is Dead (let me emphasize the first word, traditional ).
After 416,350 words in posts and 845,128 words in comments on this blog, thus far, there is always more to explore, illuminate and share. Hence every once in a while I flip the tables and ask you for challenges you are facing. It is a great way to stay connected to what's most important to you (and keep the blog and its content relevant!). This past Monday I asked for your questions and you were kind enough to share some awesome questions.
Day in and day out we stare at standard tables and rows and convert them into smaller or scarier tables and rows and through analysis we try and move the really heavy beast called the "organization" into action. It is hard. This blog post has three ideas I've learned from other smart people, ideas that help surprise the "organization" with something non-normal and get it to take action.
Many software teams have migrated their testing and production workloads to the cloud, yet development environments often remain tied to outdated local setups, limiting efficiency and growth. This is where Coder comes in. In our 101 Coder webinar, you’ll explore how cloud-based development environments can unlock new levels of productivity. Discover how to transition from local setups to a secure, cloud-powered ecosystem with ease.
Lots of people know that the Riemann Hypothesis has something to do with prime numbers, but most introductions fail to say what or why. I’ll try to give one angle of explanation. Layman’s Terms. Suppose you have a bunch of friends, each with an instrument that plays at a frequency equal to the imaginary part of a zero of the Riemann zeta function.
Many of you are aware that I am the co-Founder of Market Motive, a delightful little labor of love whose mission in life is to provide bleeding edge education via quarterly, what we call, Master Certification courses. There are seven courses in all: SEO, PPC, Social Media, Web Analytics, Conversion Optimization, Marketing Fundamentals and Online PR.
Kickstarter is an online crowdfunding platform for launching creative projects. When starting a new project, project owners specify a deadline and the minimum amount of money they need to raise. They receive the money (less a transaction fee) only if they reach or exceed that minimum; otherwise, no money changes hands. What’s particularly fun about Kickstarter is that in contrast to that other microfinance site , Kickstarter projects don’t ask for loans; instead, patrons receive pre-
I was playing around with the Hacker News database Ronnie Roller made (thanks!), so I thought I’d post some of the things I looked at. Activity on the Site. My first question was how activity on the site has increased over time. I looked at number of posts, points on posts, comments on posts, and number of users. Posts. This looks like a strong linear fit, with an increase of 292 posts every month.
Large enterprises face unique challenges in optimizing their Business Intelligence (BI) output due to the sheer scale and complexity of their operations. Unlike smaller organizations, where basic BI features and simple dashboards might suffice, enterprises must manage vast amounts of data from diverse sources. What are the top modern BI use cases for enterprise businesses to help you get a leg up on the competition?
Measure theory studies ways of generalizing the notions of length/area/volume. Even in 2 dimensions, it might not be clear how to measure the area of the following fairly tame shape: much less the “area” of even weirder shapes in higher dimensions or different spaces entirely. For example, suppose you want to measure the length of a book (so that you can get a good sense of how long it takes to read).
tl;dr See this movie visualization for a case study on how a post propagates through Quora. How does information spread through a network? Much of Quora’s appeal, after all, lies in its social graph – and when you’ve got a network of users, all broadcasting their activities to their neighbors, information can cascade in multiple ways.
(See a demo here.). While working on a Twitter sentiment analysis project, I ran into the problem of needing to filter out all non-English tweets. (Asking the Twitter API for English-only tweets doesn’t seem to work, as it nonetheless returns tweets in Spanish, Portuguese, Dutch, Russian, and a couple other languages.). Since I didn’t have any labeled data, I thought it would be fun to build an unsupervised language classifier.
(Way back when, I went through all the Netflix prize papers. I’m now (very slowly) trying to clean up my notes and put them online. Eventually, I hope to have a more integrated tutorial, but here’s a rough draft for now.). This is a summary of Koren’s 2008 Factorization Meets the Neighborhood: a Multifaceted Collaborative Filtering Model.
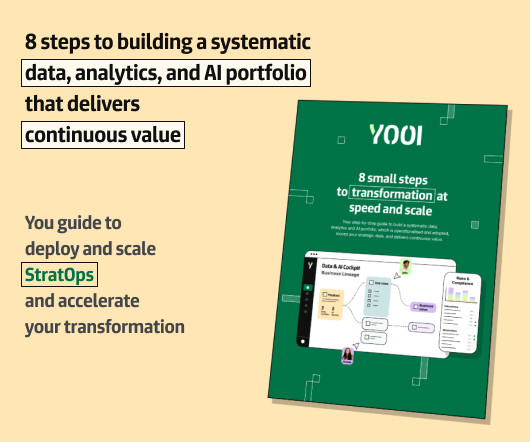
📌Is your Data & AI transformation struggling to really impact the business? Discover the game-changing StratOps approach that: Bridges the Gap : Connect your Data & AI strategy to your operating model, to ensure alignment at every level. Prioritizes Outcomes : Focuses on concrete business outcomes from day one, rather than capabilities in isolation.
We organize all of the trending information in your field so you don't have to. Join 42,000+ users and stay up to date on the latest articles your peers are reading.
You know about us, now we want to get to know you!
Let's personalize your content
Let's get even more personalized
We recognize your account from another site in our network, please click 'Send Email' below to continue with verifying your account and setting a password.


Let's personalize your content