This site uses cookies to improve your experience. To help us insure we adhere to various privacy regulations, please select your country/region of residence. If you do not select a country, we will assume you are from the United States. Select your Cookie Settings or view our Privacy Policy and Terms of Use.
Cookie Settings
Cookies and similar technologies are used on this website for proper function of the website, for tracking performance analytics and for marketing purposes. We and some of our third-party providers may use cookie data for various purposes. Please review the cookie settings below and choose your preference.
Used for the proper function of the website
Used for monitoring website traffic and interactions
Cookie Settings
Cookies and similar technologies are used on this website for proper function of the website, for tracking performance analytics and for marketing purposes. We and some of our third-party providers may use cookie data for various purposes. Please review the cookie settings below and choose your preference.
Strictly Necessary: Used for the proper function of the website
Performance/Analytics: Used for monitoring website traffic and interactions
In this post, we will explain what is a KPI scorecard, when to use it, what is the difference between scorecard and dashboard, and KPI scorecard examples and templates from business scenarios that can be applied to different departments and organizations or used as a roadmap for online data analysis. What Is A KPI Scorecard?
The 2024 Enterprise AI Readiness Radar report from Infosys , a digital services and consulting firm, found that only 2% of companies were fully prepared to implement AI at scale and that, despite the hype , AI is three to five years away from becoming a reality for most firms. Is our AI strategy enterprise-wide?
Regardless of where organizations are in their digital transformation, CIOs must provide their board of directors, executive committees, and employees definitions of successful outcomes and measurable key performance indicators (KPIs). He suggests, “Choose what you measure carefully to achieve the desired results.
BI projects aren’t just for the big fishes in the sea anymore; the technology has developed rapidly, the software has become more accessible while business intelligence and analytics projects implemented in various industries regularly, no matter the shape and size, small businesses or large enterprises. Define goals and objectives.
Its an offshoot of enterprise architecture that comprises the models, policies, rules, and standards that govern the collection, storage, arrangement, integration, and use of data in organizations. Limit the times data must be moved to reduce cost, increase data freshness, and optimize enterprise agility. Curate the data. DAMA-DMBOK 2.
Here, we explore enterprise dashboards in more detail, looking at the benefits of corporate dashboard software as well as a mix of real industry examples. Let’s kick things off by considering what a company dashboard is — or, in other words, provide an enterprise dashboard definition. Enterprise Dashboards Examples.
Agree companywide what KPIs are most relevant for your business and how do they already develop. Research different KPI examples and compare to your own. Once you have your data analytics questions, you need to have some standard KPIs that you can use to measure them. All of these KPI examples can be valid choices.
2) What Are Small Business KPIs? 4) Small Business Dashboard & KPIs Examples. The times were data analysis was segregated to big enterprises that had the necessary resources to carry it out are long gone. To get you started on the topic, you can take a look at our post on KPIs vs metrics. Marketing KPI dashboard.
The secret is out, and has been for a while: In order to remain competitive, businesses of all sizes, from startup to enterprise, need business intelligence (BI). Of course, it is also important to choose the right KPI. An effective dashboard combines information dynamically to measure performance and drive business strategy.
By implementing the right reporting tools and understanding how to analyze as well as to measure your data accurately, you will be able to make the kind of data driven decisions that will drive your business forward. Qualitative data analysis is based on observation rather than measurement. 9) Set measurable goals for decision making.
KPI dashboard releases you from your worries and troubles. What is a KPI dashboard? Definition of KPI dashboard. KPIs (Key performance indicators) are quantitative indicators used to measure the work performance of staff, being the foundation of an enterprise performance management system.
These past BI issues may discourage them to adopt enterprise-wide BI software. The price of deploying BI is a primary concern among small and medium-sized enterprises (SMEs). In the past, expensive enterprise BI solutions required huge hardware resources. They need to see a cloud-based enterprise-wide BI tool in action.
That’s why it is of utmost importance to start with utilizing the right key performance indicators – there are numerous KPI examples that can make or break the quality process of data management. The consequences of bad data quality are numerous; from the accuracy of understanding your customers to constructing the right business decisions.
As mentioned, SaaS (software as a service) enterprises operate in an incredibly competitive market. A SaaS KPI dashboard will help you do just that. This KPI offers a graphical representation of the costs associated with converting a prospect, allowing you to set solid targets to reduce your CAC over a set time period.
IT leaders are drowning in metrics, with many finding themselves up to their KPIs in a seemingly bottomless pool of measurement tools. There are several important metrics that can be used to achieve IT success, says Jonathan Nikols, senior vice president of global enterprise sales for the Americas at Verizon. “To Here they are.
A revenue graph that is worth exploring on a monthly basis by utilizing a modern KPI reporting software. 11) Sales KPI Dashboard. Primary KPIs: Revenue per Sales Rep. Last but certainly not least in our rundown of sales graph examples is our incremental sales by campaign KPI. 9) Amount Of Sales By Payment Method.
The examples of business reports that we used in this article can be utilized in many different industries, the data can be customized based on the factual information of the specific department, organization, company or enterprise. Sales KPI dashboard. Achieving a design like this is simple with the right KPI dashboard software.
AI’s honeymoon with the enterprise is coming to an end. In 2023, enterprises worldwide spent $166 billion on AI solutions (AI software, hardware, and services), but that spending is expected to grow 27% per year to $423 billion by 2027, according to IDC’s report. Some KPIs are tied to customer satisfaction scores or revenue growth.
Business intelligence strategy is seen as a roadmap designed to help companies measure their performance and strengthen their performance through architecture and solutions. At the same time, enterprises can use the BI strategy to reach various business objectives gradually. KPI dashboard for Finance (from FineReport).
But let’s see in more detail what the benefits of these kinds of reporting practices are, and how businesses, whether small or enterprises, can develop profitable results. Every serious business uses key performance indicators to measure and evaluate success. Benefits Of Business Intelligence And Reporting.
Companies, organizations, enterprises, large, or small businesses – no matter in which category you belong to, you need to pay close attention to your customers. Now we will talk about each metric in detail and why they are important in establishing a proper process on how to measure customer retention.
Like most CIOs you’ve no doubt leaned on ROI, TCO and KPIs to measure the business value of your IT investments. Those Three Big Acronyms are still important for fine-tuning your IT operations, but success today is increasingly measured in business outcomes. Maybe you’ve even surpassed expectations in each of these yardsticks.
Franchetti acknowledges that a KPI- and outcome-driven method is still appropriate for many technology rollouts, but “the organic approach is better for AI, so our deep software development subject matter experts can innovate without a targeted business outcome,” he says. Today, 35% of our IT support is fully automated.
This includes defining the main stakeholders, assessing the situation, defining the goals, and finding the KPIs that will measure your efforts to achieve these goals. For this reason, implementing measures to stay compliant with data privacy regulations is a must when building your BI roadmap strategy.
Cloud usage & costs Most enterprise companies have shared infrastructure, and managing cost allocation across marketing, HR, accounting, and other departments can be tricky. However, it can be challenging to measure the business value associated with each type of cloud resource based on performance, availability, and other factors.
Living in a digital era, foresighted enterprises resort to business intelligence to improve their competitiveness. Be more specific, it is a data virtualization tool that shows the status of measurement information and key business indicators (KPI) to enterprises. BI dashboard software definition. FineReport.
In this case, there is a clear KPI or metric for success, and you know what your project is setting out to do for you, which is a much more efficient way to approach digital transformation. Perhaps, instead of having 100 clients coming into the store, you’d want your products to be seen by ten times that number in one day.
At many companies, executives are advocating for comprehensive environmental measures, investors are demanding more sustainable ventures, and customers are increasingly seeking low-carbon products to combat pollution and preserve biodiversity. The multinational professional services leader is hardly alone.
KPIs make sure you can track and audit optimal implementation, achieve consumer satisfaction and trust, and minimize disruptions during the final transition. They measure workload trends, cost usage, data flow throughput, consumer data rendering, and real-life performance. The following table summarizes the relevant tenant-level KPIs.
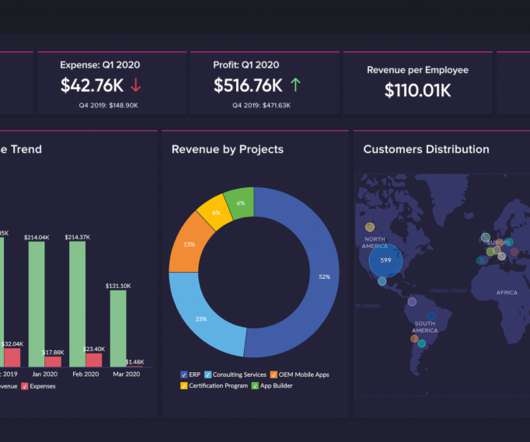
As important parts of business intelligence, scorecards and dashboards can both play an obvious role in promoting enterprise performance management. This article aims to provide a reference for the choice of enterprises. Financial KPI Dashboard (From FineReport?. Definition of scorecard and dashboard. What is a scorecard?
But how to make a digital marketing report that satisfying the enterprise needs? It is not only crucial for measuring the traffic but also for evaluating brand influence and marketing research. Marketing KPI Report. KPIs in marketing are measurable values related to specific goals of marketing activities.
Visual presentation of performance measures Timesaving—Measure efficiencies or inefficiencies Command a fine view of all systems instantly Quick identification of data outliers and correlations Identify trends More informed decisions based on business intelligence. KPI dashboard. First, we need to figure out ‘What is a KPI?’.
In IDCs April 2024 CIO Poll Survey of 105 senior IT professionals and CIOs, developing better IT governance and enterprise architecture emerged as one of the top priorities for 2024, ranking fourth. Eveline Oehrlich , a director in IDCs IT Executive Programs (IEP), is the former chief research officer at PeopleCert and DevOps Institute.
An efficient sustainable supply chain process with optimized CO2 footprint is an enterprise requirement as well as a societal need. A Process Mining exercise drawing data from enterprise SAP has helped measureKPI performance and define the transformation roadmap. Process and Technology have never been so closely linked.
If the accounts department is the lungs of the enterprise, directing money (oxygen) in and out of the organization, it’s understandable that accounts receivable receives so much focus; without a consistent influx of cash, no company can survive for long.
The importance of the supplier ecosystem Suppliers are one of the enterprise’s most valuable elements, so it’s important to partner well in this arena. Measuring compliance is a critical KPI for accountability. Are internal stakeholders following policies or going outside the system?
According to Gartner , CPM is “an umbrella term that describes the methodologies, metrics, processes and systems used to monitor and manage the business performance of an enterprise.”. Companies use CPM to measure their performance against their stated objectives, goals, and strategies. What Is CPM and What Does It Do?
From startups to big enterprises, businesses are collecting more and more data every day and, it is no secret, that whoever is not taking advantage of it will simply stay behind. The value of this monthly reporting template created with professional KPI reporting software lies in its interactivity. Table of Contents.
SaaS(Software-as-a-Service) reporting is a cloud-based application that uses subscription-based pricing to deliver reporting, dashboard services to enterprises. It helps companies with self-reporting , KPI monitoring, search engine optimization, scheduling, social media marketing, custom reports, data exporting & archiving, and more.
As a part of enterprise informationization, there are many reasons for BI platform to do separate management and disaster recovery. On the one hand, governments, Internet companies, and large enterprises attach great importance to informatization construction and require separate maintenance. Metadata management. Analytics dashboards.
DORA will create a uniform set of requirements for the supply chain that will range from incident notification all the way to contractual terms, customer exit strategies and KPI monitoring. In Europe, you sometimes hear complaints about GDPR.
Moreover, 57% of enterprise organizations currently employ a chief data officer, another study conducted by MicroStrategy. By setting KPIs that align with your business’s goals, aims, and aspirations, you’ll be able to evaluate your progress accurately and understand whether you’re meeting important milestones. Interactivity.
Determine Key Performance Indicators Next step for the BI team is to work together to determine the Key Performance Indicators (KPIs) for the business. These must be measurable numbers that indicate whether the business is meeting its goals and where it needs to make improvements.
Not to mention, 72% of companies report that their enterprises are regular to heavy users of social media data to improve customer relationships. Follow your strategy and not what’s trending in your industry, so you can define the much-needed KPIs or Key Performance Indicators. Continuously Gather Data.
We organize all of the trending information in your field so you don't have to. Join 42,000+ users and stay up to date on the latest articles your peers are reading.
You know about us, now we want to get to know you!
Let's personalize your content
Let's get even more personalized
We recognize your account from another site in our network, please click 'Send Email' below to continue with verifying your account and setting a password.


Let's personalize your content