This site uses cookies to improve your experience. To help us insure we adhere to various privacy regulations, please select your country/region of residence. If you do not select a country, we will assume you are from the United States. Select your Cookie Settings or view our Privacy Policy and Terms of Use.
Cookie Settings
Cookies and similar technologies are used on this website for proper function of the website, for tracking performance analytics and for marketing purposes. We and some of our third-party providers may use cookie data for various purposes. Please review the cookie settings below and choose your preference.
Used for the proper function of the website
Used for monitoring website traffic and interactions
Cookie Settings
Cookies and similar technologies are used on this website for proper function of the website, for tracking performance analytics and for marketing purposes. We and some of our third-party providers may use cookie data for various purposes. Please review the cookie settings below and choose your preference.
Strictly Necessary: Used for the proper function of the website
Performance/Analytics: Used for monitoring website traffic and interactions
Enterprises do not operate in a vacuum, and things happening outside an organizations walls directly impact performance. So, it is essential to incorporate external data in forecasting, planning and budgeting, especially for predictive analytics and machine learning to support artificial intelligence.
Even with advances in building robust models, the reality is that noisy data and incomplete data remain the biggest hurdles to effective end-to-end solutions. The problem is even more magnified in the case of structured enterprise data. The models are then used to spot errors and suggest the “most probable” values to replace.
Even basic predictivemodeling can be done with lightweight machine learning in Python or R. In life sciences, simple statistical software can analyze patient data. The results of these models are then combined using a simple algorithm to determine the best-performing model for a given item, which is then used for prediction.
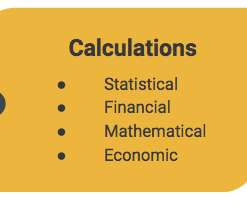
A data scientist must be skilled in many arts: math and statistics, computer science, and domain knowledge. Statistics and programming go hand in hand. Mastering statistical techniques and knowing how to implement them via a programming language are essential building blocks for advanced analytics. Linear regression.
Today, organizations look to data and to technology to help them understand historical results, and predict the future needs of the enterprise to manage everything from suppliers and supplies to new locations, new products and services, hiring, training and investments. But too much data can also create issues.
Predictive analytics, sometimes referred to as big data analytics, relies on aspects of data mining as well as algorithms to develop predictivemodels. These predictivemodels can be used by enterprise marketers to more effectively develop predictions of future user behaviors based on the sourced historical data.
Business analytics is the practical application of statistical analysis and technologies on business data to identify and anticipate trends and predict business outcomes. Data analytics is used across disciplines to find trends and solve problems using data mining , data cleansing, data transformation, data modeling, and more.
While some experts try to underline that BA focuses, also, on predictivemodeling and advanced statistics to evaluate what will happen in the future, BI is more focused on the present moment of data, making the decision based on current insights. What Is Business Intelligence And Analytics?
The US Bureau of Labor Statistics (BLS) forecasts employment of data scientists will grow 35% from 2022 to 2032, with about 17,000 openings projected on average each year. You need experience in machine learning and predictivemodeling techniques, including their use with big, distributed, and in-memory data sets.
The chief aim of data analytics is to apply statistical analysis and technologies on data to find trends and solve problems. Data analytics has become increasingly important in the enterprise as a means for analyzing and shaping business processes and improving decision-making and business results.
Candidates are required to complete a minimum of 12 credits, including four required courses: Algorithms for Data Science, Probability and Statistics for Data Science, Machine Learning for Data Science, and Exploratory Data Analysis and Visualization. It also recommends answering sample questions it provides and taking a practice exam.
Through a marriage of traditional statistics with fast-paced, code-first computer science doctrine and business acumen, data science teams can solve problems with more accuracy and precision than ever before, especially when combined with soft skills in creativity and communication. Math and Statistics Expertise.
Put simply, predictive analytics is a method used to forecast and predict the future results and needs of an organization using historical data and a comprehensive set of data from across and outside the enterprise. PredictiveModeling allows users to test theories and hypotheses and develop the best strategy.
Synchrony isn’t the only company dealing with a dearth of data scientists to perform increasingly critical work in the enterprise. The research report also noted that top enterprises, such as Deloitte, Amazon and Microsoft, are looking to fill a wide spectrum of technical jobs but data science far outweighs all other roles.
Artificial Intelligence and generative AI are beginning to change how enterprises do many things, especially planning and budgeting. This organization would be responsible for supporting the planning activities of individual business units of an enterprise.
The technology research firm, Gartner has predicted that, ‘predictive and prescriptive analytics will attract 40% of net new enterprise investment in the overall business intelligence and analytics market.’ Descriptive Statistics. Access to Flexible, Intuitive PredictiveModeling. Trends and Patterns.
But the ranks of the CAIO are expected to increase at enterprise organizations as well in the coming years. And they should have a proficiency in data science and analytics to effectively leverage data-driven insights and develop AI models. This includes skills in statistical analysis, data visualization, and predictivemodeling.
As this technology becomes more popular, it’s increased the demand for relevant roles to help design, develop, implement, and maintain gen AI technology in the enterprise. It’s a role that requires experience with natural language processing , coding languages, statisticalmodels, and large language and generative AI models.
‘By providing this type of expanded functionality to the team, the business can enable both data scientists and business users with predictive analytics that will benefit the organization.’. Understanding Assisted PredictiveModeling. The Benefits and Importance of Assisted PredictiveModeling.
The Smarten Augmented Analytics suite includes Smart Data Visualization , AI and Assisted PredictiveModeling , Self-Serve Data Preparation , Natural Language Processing (NLP) and Search Analytics , SnapShot Monitoring and Alerts , and many other sophisticated features.
It not only increases the speed and transparency of decisions and their quality, but it is also the foundation for the use of predictive planning and forecasting powered by statistical methods and machine learning. Many companies have a lot of catching up to do when it comes to the robust integration of enterprise planning.
Smarten has announced the launch of PredictiveModel Mark-Up Language (PMML) Integration capability for its Smarten Augmented Analytics suite of products. Simply create the predictivemodel, using your favorite platform, export the model as a PMML file and import that model to Smarten.
With the big data revolution of recent years, predictivemodels are being rapidly integrated into more and more business processes. When business decisions are made based on bad models, the consequences can be severe. Figure 1: The main components of a model as defined by banking industry regulators.
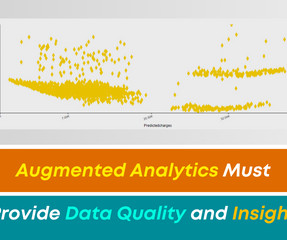
These enterprises will typically focus on building a team of data scientists or business analysts to help with this task OR they might take on an augmented analytics initiative to provide access to data and analytics for their business users. How Can I Ensure Data Quality and Gain Data Insight Using Augmented Analytics?
The ‘data’ part is the statistics and data display. . Business understanding’ is realizing in-depth data analysis and smart data forecasting via analysis and prediction functions such as data mining, predictivemodeling, and so on. FineReport is a professional BI reporting tool designed for the enterprise. .
My team uses augmented data preparation and self-serve data prep, and tools like smart data visualization, plug n’ play predictive analysis and assisted predictivemodeling to connect all the dots, find those all-important exceptions, and identify patterns and trends so they can get ahead of the game and help us in the market.
Assisted PredictiveModeling – These tools enable the average business user to leverage sophisticated predictive algorithms without requiring statistical or data science skills. ” There are many features and benefits to the Smarten approach to Advanced Data Discovery.
Smarten Augmented Analytics tools include Assisted PredictiveModeling , Smart Data Visualization , Self-Serve Data Preparation , Sentiment Analysis , and Clickless Analytics with natural language processing (NLP) for search analytics.
Predictive Analytics utilizes various techniques including association, correlation, clustering, regression, classification, forecasting and other statistical techniques. Businesses must control quality or risk losing customers and market share and exposing the enterprise to legal risk and liability. Customer Churn.
’ ARIMAX is related to the ARIMA technique but, while ARIMA is suitable for datasets that are univariate (see the article, entitled’ What is ARIMA Forecasting and How Can it Be Used for Enterprise Analysis?’). How Can ARIMAX Forecasting Be Used for Enterprise Analysis?
Data science is an area of expertise that combines many disciplines such as mathematics, computer science, software engineering and statistics. It includes a range of capabilities that enable enterprises to unlock the value of their data in new ways. Those who work in the field of data science are known as data scientists.
Correlation is a statistical measure that indicates the extent to which two variables fluctuate together. How Can the Karl Pearson Correlation Method Be Used to Target Enterprise Analytical Needs? This article explains the Karl Pearson Correlation method of analysis, and how it can be applied in business.
Simple Linear Regression is a statistical technique that attempts to explore the relationship between one independent variable (X) and one dependent variable (Y). How Can the Enterprise Use Simple Linear Regression to Analyze Data? This article describes the Simple Linear Regression method of analysis. What is Simple Linear Regression?
SnapShot Monitoring provides powerful data analytical features that reveal trends and anomalies and allow the enterprise to map targets and adapt to changing markets with clear, prescribed actions for continuous improvement. Smarten announces the launch of SnapShot Anomaly Monitoring Alerts for Smarten Augmented Analytics.
Instead of transacting business with only a paper record, enterprise applications recorded transactions in a computer database. The foundation of predictive analytics is based on probabilities. The credit scores generated by the predictivemodel are then used to approve or deny credit cards or loans to customers.
World-renowned technology analysis firm Gartner defines the role this way, ‘A citizen data scientist is a person who creates or generates models that leverage predictive or prescriptive analytics, but whose primary job function is outside of the field of statistics and analytics. ‘If Automatic generation of models.
q: to apply moving average model on series. How Can the ARIMA Forecasting Method Be Used for Enterprise Analysis? Business Problem: A pharmaceutical company wants to predict the sales of a drug for the next two months, based on drug sales data from the past 12 months.
Tools like Assisted PredictiveModeling allow the average business user to become a Citizen Data Scientist with tools that offer guidance and auto-suggestions to help the user arrive at the outcome they need without being frustrated or having to call in an army of analysts and IT staff to help them complete their analysis.
Assisted PredictiveModeling and Auto Insights to create predictivemodels using self-guiding UI wizard and auto-recommendations The Future of AI in Analytics The C=suite executive survey revealed that 93% felt that data strategy is critical to getting value from generative AI, but a full 57% had made no changes to their data.
Learning for Citizen Data Scientists and Data Literacy Across the Enterprise! So you want to transform your business users and encourage learning for Citizen Data Scientists to enable data literacy across your enterprise? Descriptive Statistics. Consider the myriad of techniques used by data scientists and analysts!
As the majority class = Good for the three nearest neighbors (two out of three records have class = Good), predicted class of an instance = Good, i.e. quality of a paper tissue having acid durability =3 and strength =7 is good. How Can KNN Classification Help an Enterprise?
How Does an Enterprise Use the KMeans Clustering Algorithm to Analyze Data? Smarten Augmented Analytics tools include plug n’ play predictive analytics , assisted predictivemodeling , smart data visualization , self-serve data preparation and clickless analytics for search analytics with natural language processing (NLP).
Data Model. Conventional enterprise data types. Small or medium sized models; dimensional and denormalized mainly, occasionally more normalized model. a data mart) or more comprehensively as an Enterprise Data Warehouse. Connects to Druid, Impala, Hive, and other enterprise data sources. Tech Preview).
Widely used to discover trends, patterns, check assumptions and spot anomalies or outliers, EDA involves a variety of techniques including statistical analysis, and machine learning to gain a better understanding of data. With the exponential growth of large datasets, predictive analytics is being leveraged by enterprises across industries.
We organize all of the trending information in your field so you don't have to. Join 42,000+ users and stay up to date on the latest articles your peers are reading.
You know about us, now we want to get to know you!
Let's personalize your content
Let's get even more personalized
We recognize your account from another site in our network, please click 'Send Email' below to continue with verifying your account and setting a password.


Let's personalize your content