This site uses cookies to improve your experience. To help us insure we adhere to various privacy regulations, please select your country/region of residence. If you do not select a country, we will assume you are from the United States. Select your Cookie Settings or view our Privacy Policy and Terms of Use.
Cookie Settings
Cookies and similar technologies are used on this website for proper function of the website, for tracking performance analytics and for marketing purposes. We and some of our third-party providers may use cookie data for various purposes. Please review the cookie settings below and choose your preference.
Used for the proper function of the website
Used for monitoring website traffic and interactions
Cookie Settings
Cookies and similar technologies are used on this website for proper function of the website, for tracking performance analytics and for marketing purposes. We and some of our third-party providers may use cookie data for various purposes. Please review the cookie settings below and choose your preference.
Strictly Necessary: Used for the proper function of the website
Performance/Analytics: Used for monitoring website traffic and interactions
However, the metrics used to evaluate CIOs are hindering progress. While the CIO role has expanded significantly, the metrics used to evaluate their performance often remain tied to traditional IT values like cost management, operational efficiency, and system uptime. The CIO is no longer the chief of “keeping the lights on.”
In our cutthroat digital economy, massive amounts of data are gathered, stored, analyzed, and optimized to deliver the best possible experience to customers and partners. At the same time, inventory metrics are needed to help managers and professionals in reaching established goals, optimizing processes, and increasing business value.
CRAWL: Design a robust cloud strategy and approach modernization with the right mindset Modern businesses must be extremely agile in their ability to respond quickly to rapidly changing markets, events, subscriptions-based economy and excellent experience demanding customers to grow and sustain in the ever-ruthless competitive world of consumerism.
6) Data Quality Metrics Examples. Reporting being part of an effective DQM, we will also go through some data quality metrics examples you can use to assess your efforts in the matter. The data quality analysis metrics of complete and accurate data are imperative to this step. Table of Contents. 2) Why Do You Need DQM?
This can help you optimize long-term cost for high-throughput use cases. After you identify the steady state workload for your log aggregation use case, we recommend moving to Provisioned mode, using the number of shards identified in On-Demand mode. In general, we recommend using one Kinesis data stream for your log aggregation workload.
We outline cost-optimization strategies and operational best practices achieved through a strong collaboration with their DevOps teams. We also discuss a data-driven approach using a hackathon focused on cost optimization along with Apache Spark and Apache HBase configuration optimization. This sped up their need to optimize.
Apache Kafka stands as a widely recognized open source event store and stream processing platform. One key advantage of opting for managed Kafka services is the delegation of responsibility for broker and operational metrics, allowing users to focus solely on metrics specific to applications.
Furthermore, you can gain insights into the performance of your data transformations with detailed execution logs and metrics, all accessible through the dbt Cloud interface. Cost management and optimization – Because Athena charges based on the amount of data scanned by each query, cost optimization is critical.
Speaking at a university event in Taiwan, TSMC CEO and Chairman C.C. Despite these setbacks and increased costs, Wei expressed optimism during the companys recent earnings call, assuring that the Arizona plant would meet the same quality standards as its facilities in Taiwan and forecasting a smooth production ramp-up.
Before we drown in dashboard dystopia, let’s swing the pendulum back to create meaningful metrics and measurement that will move your business forward and at the same time drive the outcomes that your customers want.
Hydro is powered by Amazon MSK and other tools with which teams can move, transform, and publish data at low latency using event-driven architectures. As the use of Hydro grows within REA, it’s crucial to perform capacity planning to meet user demands while maintaining optimal performance and cost-efficiency.
From the CEO’s perspective, an optimized IT services portfolio maximizes cost efficiency, flexibility, and scalability. Highly optimized portfolios leverage outsourcing to ensure that commodity-based sourcing is offloaded to outsourcers, freeing up internal teams to focus on strategic projects that add value and effectively manage costs.
We then guide you on swift responses to these events and provide several solutions for mitigation. Imagine you have a fleet of web servers logging performance metrics for each web request served into a Kinesis data stream with two shards and you used a request URL as the partition key. Why do we get write throughput exceeded errors?
by YI LIU Importance sampling is used to improve precision in estimating the prevalence of some rare event in a population. This problem can be phrased as an optimization problem — given some fixed review capacity how should we sample videos? Our goal is a better sampling design to improve the precision of the prevalence estimates.
Real-time data streaming and event processing present scalability and management challenges. In this post, Nexthink shares how Amazon Managed Streaming for Apache Kafka (Amazon MSK) empowered them to achieve massive scale in event processing. This allows IT to evolve from reactive problem-solving to proactive optimization.
My strong interest hasn’t diminished, and neither has Splunk’s developments and product releases in that space, as seen in observability’s prominent mention within many of Splunk’s announcements at this year’s.conf23 event. I call that “digital resilience for the win!”
A COO (chief operating officer) dashboard is a visual management tool used by COOs to connect multiple data sources, track, evaluate, and help COOs to optimize operational processes within a company by using interactive metrics and advanced analytical capabilities. Choose the most valuable metrics for your industry.
In this post, we explore how to combine AWS Glue usage information and metrics with centralized reporting and visualization using QuickSight. You have metrics available per job run within the AWS Glue console, but they don’t cover all available AWS Glue job metrics, and the visuals aren’t as interactive compared to the QuickSight dashboard.
Amazon EMR on EC2 , Amazon EMR Serverless , Amazon EMR on Amazon EKS , Amazon EMR on AWS Outposts and AWS Glue all use the optimized runtimes. This is a further 32% increase from the optimizations shipped in Amazon EMR 7.1 The following table summarizes the metrics. Metric Amazon EMR 7.5 Metric Amazon EMR 7.5
By leveraging AI for real-time event processing, businesses can connect the dots between disparate events to detect and respond to new trends, threats and opportunities. AI and event processing: a two-way street An event-driven architecture is essential for accelerating the speed of business.
It just crossed $100M in revenue and is approaching a major liquidity event, such as an IPO. But as you speak with an expanding cadre of lawyers, accountants, and bankers, you start to appreciate what such an event means for your department. And second, you have a clear metric of improvement: the number of days taken to close.”
Cloudera has partnered with Rill Data, an expert in metrics at any scale, as Cloudera’s preferred ISV partner to provide technical expertise and support services for Apache Druid customers. Deploying metrics shouldn’t be so hard. Highly optimized time series queries. Intuitive metrics, simple design. Min/Max values.
In this post, we explore how to deploy Amazon CloudWatch metrics using an AWS CloudFormation template to monitor an OpenSearch Service domain’s storage and shard skew. This allows write access to CloudWatch metrics and access to the CloudWatch log group and OpenSearch APIs. An OpenSearch Service domain. Choose Next.
Overview of the auto-copy feature in Amazon Redshift The auto-copy feature in Amazon Redshift leverages the S3 event integration to automatically load data into Amazon Redshift and simplifies automatic data loading from Amazon S3 with a simple SQL command. You can enable Amazon Redshift auto-copy by creating auto-copy jobs.
Credit: Future Enterprise Resiliency and Spending Survey, Wave 10, October 2024 (n = 70 IT C-level executives) While these rising budgets reflect optimism about GenAIs potential, they also create pressure to justify every dollar spent. million in 2025 to $7.45 million in 2026, covering infrastructure, models, applications, and services.
A growing number of organizations especially in the event management industry or sector are using workforce analytics to examine and act upon data about their people in the workplace. Workforce analytics in Event Industry – Its Relevancy in today’s HR environment. Derives metrics for benchmark interpretation and trends.
Here are just a few examples of the benefits of using LLMs in the enterprise for both internal and external use cases: Optimize Costs. Furthermore, Fine Tuning Studio comes with deep MLFlow experiments integration , so every metric related to a fine tuning job can be viewed in Cloudera AI’s Experiments view. Data Preparation.
CloudOps is an operations practice for managing the delivery, optimization, and performance of IT services and workloads running in a cloud environment. At a governance layer, we can implement better budgeting and financial tracking and optimization. What is CloudOps? Effective CloudOps [helps] to mitigate this.
Sales Analytics in Event Industry – A Perspective View. In the event industry, respondents are recognizing the importance of leveraging tools to streamline their attendees’ experiences with already existing event technologies. Image Source: [link]. It can help the wider company management team in making better decisions.
By using dbt Cloud for data transformation, data teams can focus on writing business rules to drive insights from their transaction data to respond effectively to critical, time sensitive events. Solution overview Let’s consider TICKIT , a fictional website where users buy and sell tickets online for sporting events, shows, and concerts.
A manufacturing Key Performance Indicator (KPI) or metric is a well defined and quantifiable measure that the manufacturing industry uses to gauge its performance over time. Manufacturing companies specifically use KPIs to monitor, analyze, and optimize operations, often comparing their efficiencies to those of competitors in the same sector.
When it comes to near-real-time analysis of data as it arrives in Security Lake and responding to security events your company cares about, Amazon OpenSearch Service provides the necessary tooling to help you make sense of the data found in Security Lake. Services such as Amazon Athena and Amazon SageMaker use query access.
In the event that any of them crash, the entire cluster goes down. This enhanced diversity helps optimize for cost and performance while increasing the likelihood of fulfilling capacity requirements. The following screenshot shows an example of these metrics. The following screenshot shows an example of the CloudWatch metrics.
Despite their advantages, traditional data lake architectures often grapple with challenges such as understanding deviations from the most optimal state of the table over time, identifying issues in data pipelines, and monitoring a large number of tables. It is essential for optimizing read and write performance.
That way, any unexpected event will be immediately registered and the system will notify the user. It is characterized by techniques such as graph analysis, simulation, complex event processing, neural networks, recommendation engines, heuristics, and machine learning. 5) Collaborative Business Intelligence.
Essentially, you’ll want to assign a specific lead generation or conversion metric to SEO. The metric itself will depend upon your site’s goals. Event: Whether they triggered an event, i.e. played a video, downloaded a file. So, it’s best to use Destinations, or Events goals for SEO instead. Image Source ).
For container terminal operators, data-driven decision-making and efficient data sharing are vital to optimizing operations and boosting supply chain efficiency. This post is co-written by Dr. Leonard Heilig and Meliena Zlotos from EUROGATE. Lakshmi Nair is a Senior Specialist Solutions Architect for Data Analytics at AWS.
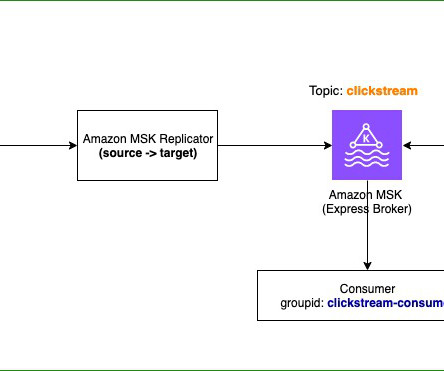
The VolumeReadBytes and VolumeWriteBytes metrics should be checked to make sure the source cluster volume throughput has additional bandwidth to handle any additional read from the disk. Monitor replication When the MSK replicator is up and running, monitor the MessageLag metric. The MessageLag metric should come down to 0.
Metrics that create a narrative and show how the business compares to competitors, the wider industry, and globally against all businesses give a clear picture that allows board members to set strategy. The event is free to attend for qualified attendees. They want something that’s going to punch them in the face,” he said.
For example, McKinsey suggests five metrics for digital CEOs , including the financial return on digital investments, the percentage of leaders’ incentives linked to digital, and the percentage of the annual tech budget spent on bold digital initiatives. As a result, outcome-based metrics should be your guide.
However, without knowing how to obtain this information or what to do with it, you may find yourself mindlessly browsing arbitrary metrics on Google Analytics such as user data, session data, or session durations. It allows you to accurately measure your rate of success or failure and make optimizations accordingly.
Use case Consider a large company that relies heavily on data-driven insights to optimize its customer support processes. Amazon CloudWatch , a monitoring and observability service, collects logs and metrics from the data integration process. Check CloudWatch log events for the SEED Load. Open the AWS Glue console.
Data analytics make up the relevant key performance indicators ( KPIs ) or metrics necessary for a business to create various sales and marketing strategies. Consequently, you can make smarter decisions and hit your metrics and overall business goals. Data analytics refers to the systematic computational analysis of statistics or data.
Unlike traditional approaches, deep automation is holistic, adaptive, and evolutive, prioritizing human-machine partnership and customer experience for optimal efficiency and impact. AI-integrated tractors, planters, and harvesters form a data-driven team, optimizing tasks and empowering farmers.
We organize all of the trending information in your field so you don't have to. Join 42,000+ users and stay up to date on the latest articles your peers are reading.
You know about us, now we want to get to know you!
Let's personalize your content
Let's get even more personalized
We recognize your account from another site in our network, please click 'Send Email' below to continue with verifying your account and setting a password.


Let's personalize your content