This site uses cookies to improve your experience. To help us insure we adhere to various privacy regulations, please select your country/region of residence. If you do not select a country, we will assume you are from the United States. Select your Cookie Settings or view our Privacy Policy and Terms of Use.
Cookie Settings
Cookies and similar technologies are used on this website for proper function of the website, for tracking performance analytics and for marketing purposes. We and some of our third-party providers may use cookie data for various purposes. Please review the cookie settings below and choose your preference.
Used for the proper function of the website
Used for monitoring website traffic and interactions
Cookie Settings
Cookies and similar technologies are used on this website for proper function of the website, for tracking performance analytics and for marketing purposes. We and some of our third-party providers may use cookie data for various purposes. Please review the cookie settings below and choose your preference.
Strictly Necessary: Used for the proper function of the website
Performance/Analytics: Used for monitoring website traffic and interactions
You will learn about an open-source solution that can collect important metrics from the Iceberg metadata layer. Based on collected metrics, we will provide recommendations on how to improve the efficiency of Iceberg tables. Additionally, you will learn how to use Amazon CloudWatch anomaly detection feature to detect ingestion issues.
Amazon Managed Service for Apache Flink manages the underlying Apache Flink components that provide durable application state, metrics, logs, and more. We show you how to scale by using metrics such as CPU, memory, backpressure, or any custom metric of your choice.
A financial Key Performance Indicator (KPI) or metric is a quantifiable measure that a company uses to gauge its financial performance over time. These three statements are data rich and full of financial metrics. The Fundamental Finance KPIs and Metrics – Cash Flow. What is a Financial KPI? Current Ratio. View Guide Now.
A manufacturing Key Performance Indicator (KPI) or metric is a well defined and quantifiable measure that the manufacturing industry uses to gauge its performance over time. The only way to stay ahead in this fiercely competitive industry is through the implementation of manufacturing KPIs and metrics. What Is A Manufacturing KPI?
Amazon CloudWatch , a monitoring and observability service, collects logs and metrics from the data integration process. Amazon EventBridge , a serverless event bus service, triggers a downstream process that allows you to build event-driven architecture as soon as your new data arrives in your target. Open the AWS Glue console.
Apache Flink is an open source distributed processing engine, offering powerful programming interfaces for both stream and batch processing, with first-class support for stateful processing and event time semantics. Some things to keep in mind: Stateful downgrades are not compatible and will not be accepted due to snapshot incompatibility.
The vector engine uses approximate nearest neighbor (ANN) algorithms from the Non-Metric Space Library (NMSLIB) and FAISS libraries to power k-NN search. SS4O is inspired by both OpenTelemetry and the Elastic Common Schema (ECS) and uses Amazon Elastic Container Service ( Amazon ECS ) event logs and OpenTelemetry (OTel) metadata.
In this use case, Gupshup is heavily relying on Amazon Redshift as their data warehouse to process billions of streaming events every month, performing intricate data-pipeline-like operations on such data and incrementally maintaining a hierarchy of aggregations on top of raw data.
Data-driven decisions lead to more effective responses to unexpected events, increase innovation and allow organizations to create better experiences for their customers. Short overview of Cloudinary’s infrastructure Cloudinary infrastructure handles over 20 billion requests daily with every request generating event logs.
Near-real-time streaming analytics captures the value of operational data and metrics to provide new insights to create business opportunities. These metrics help agents improve their call handle time and also reallocate agents across organizations to handle pending calls in the queue. Agent states are reported in agent-state events.
In this post, we will review the common architectural patterns of two use cases: Time Series Data Analysis and Event Driven Microservices. The streaming records are read in the order they are produced, allowing for real-time analytics, building event-driven applications or streaming ETL (extract, transform, and load).
Plus, it unifies Salesforce metrics and definitions into one data model that becomes a single source of truth for your company, meaning there’s no question about the accuracy of data and no conflict between teams about what’s accurate. Daily snapshot of opportunities that’s derived from a table of opportunities’ histories. Was it lost?
Another example is an AI-driven observability and monitoring solution where FMs monitor real-time internal metrics of a system and produces alerts. When the model finds an anomaly or abnormal metric value, it should immediately produce an alert and notify the operator. Streaming storage provides reliable storage for streaming data.
Additionally, shard redistribution during failure events causes increased resource utilization, leading to increased latencies and overloaded nodes, further impacting availability and effectively defeating the purpose of fault-tolerant, multi-AZ clusters. This event is referred to as a zonal failover.
Observability comprises a range of processes and metrics that help teams gain actionable insights into a system’s internal state by examining system outputs. The primary data classes used—known as the three pillars of observability—are logs, metrics and traces.
When a usage limit threshold is reached, events are also logged to a system table. Redshift provisioned clusters also support query monitoring rules to define metrics-based performance boundaries for workload management queues and the action that should be taken when a query goes beyond those boundaries.
You can see the time each task spends idling while waiting for the Redshift cluster to be created, snapshotted, and paused. The trigger runs in a parent process called a triggerer , a service that runs an asyncio event loop. The Cluster Activity page gathers useful data to monitor your cluster’s live and historical metrics.
Monitoring and alerting The continuous observation and analysis of system components and performance metrics to detect and address issues, optimize resource usage, and provide overall health and reliability. Amazon MWAA natively provides Airflow environment metrics and Amazon MWAA infrastructure-related metrics.
CREATE DATABASE aurora_pg_zetl FROM INTEGRATION ' ' DATABASE zeroetl_db; The integration is now complete, and an entire snapshot of the source will reflect as is in the destination. You can choose the zero-ETL integration you want and display Amazon CloudWatch metrics related to the integration.
Solution overview Let’s consider TICKIT , a fictional website where users buy and sell tickets online for sporting events, shows, and concerts. The company’s business analysts want to generate metrics to identify ticket movement over time, success rates for sellers, and the best-selling events, venues, and seasons.
Solution overview Let’s consider TICKIT , a fictional website where users buy and sell tickets online for sporting events, shows, and concerts. The company’s business analysts want to generate metrics to identify ticket movement over time, success rates for sellers, and the best-selling events, venues, and seasons.
A best practice is to pull atleast some input metrics (Visits) with some attribute metrics (% New Visits), have something that denotes customer behavior (bounce rate) and it is criminal not to have atleast a couple outcome metrics (goal conversion rate, per visit goal value). In a second the table transforms into.
This will allow defining of custom DAGs and scheduling of jobs based on certain event triggers like an input file showing up in an S3 bucket. For starters it lacks metrics around cpu, memory utilization that are easily correlated across the lifetime of the job. Self-service visual profiling and troubleshooting.
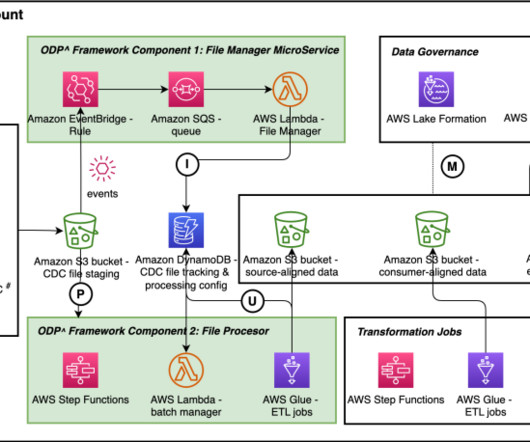
It contains references to data that is used as sources and targets in AWS Glue ETL (extract, transform, and load) jobs, and stores information about the location, schema, and runtime metrics of your data. All relevant events are then stored in a DynamoDB table. The code is deployed using the AWS CDK.
The company wanted the ability to continue processing operational data in the secondary Region in the rare event of primary Region failure. As shown in the following diagram, it consists of an Amazon EventBridge event rule, an Amazon Simple Queue Service (Amazon SQS) queue, an AWS Lambda function, and a DynamoDB table.
A typical example of this is time series data (for example sensor readings), where each event is added as a new record to the dataset. Offers different query types , allowing to prioritize data freshness (Snapshot Query) or read performance (Read Optimized Query). The following table summarizes the features.
For this solution, we use a sample dataset (normalized) provided by Amazon Redshift for event ticket sales. Additionally, we add a fifth step for demonstration purposes, which is to report and analyze business events. Lastly, we use Amazon QuickSight to gain insights on the modeled data in the form of a QuickSight dashboard.
Performance metrics appear in charts and graphs. . We might find the root cause by realizing that a problem recurs at a particular time, or coincides with another event. . We compare the current run of a job to a baseline derived from performance metrics. After moving to CDP, take a snapshot to use as a CDP baseline.
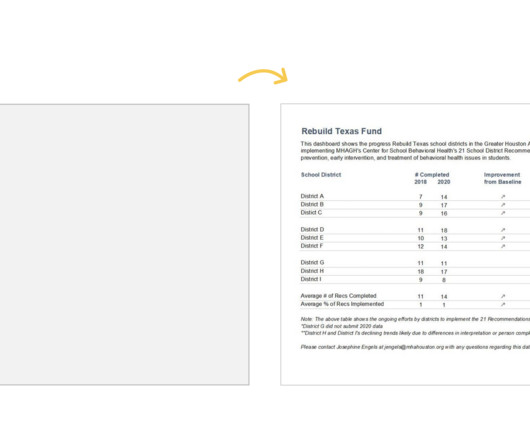
Grant Deliverables In this blog post , you’ll see how Josephine Engels did need to start from scratch — she was visualizing these metrics for her organization for the first time — and then made several dashboards to track grant deliverables. Adapt one of these dashboards instead.
Lambda as AWS Glue ETL Trigger We enabled S3 event notifications on the S3 bucket to trigger Lambda, which further partitions our data. Every dataset in our system is uniquely identified by snapshot ID, which we can search from our metadata store. The data is partitioned on InputDataSetName, Year, Month, and Date.
It has been well published since the State of DevOps 2019 DORA Metrics were published that with DevOps, companies can deploy software 208 times more often and 106 times faster, recover from incidents 2,604 times faster, and release 7 times fewer defects. The main idea of this architecture is to be event-driven with eventual consistency.
BI leverages and synthesizes data from analytics, data mining, and visualization tools to deliver quick snapshots of business health to key stakeholders, and empower those people to make better choices. AI and ML are used in concert to predict possible events and model outcomes. The BI and AI Problem: Garbage In, Garbage Out.
Anomaly detection in data analytics is defined as the identification of rare items, events or observations which deviate significantly from the majority of the data and do not conform to a well-defined notion of normal behavior. Select Augmented Analytics with Anomaly Monitoring and Alerts!
Auto recovery of multi-AZ deployment In the unlikely event of an Availability Zone failure, Amazon Redshift Multi-AZ deployments continue to serve your workloads by automatically using resources in the other Availability Zone. Choose the Maintenance Select a snapshot and choose Restore snapshot , Restore to provisioned cluster.
Ahead of the Chief Data Analytics Officers & Influencers, Insurance event we caught up with Dominic Sartorio, Senior Vice President for Products & Development, Protegrity to discuss how the industry is evolving. Life insurance needs accurate data on consumer health, age and other metrics of risk.
Orchestrate CloudTrail log aggregation with AWS Glue and Amazon MWAA In this example, we go through a use case of using Amazon MWAA to orchestrate an AWS Glue Python Shell job that persists aggregated metrics based on CloudTrail logs. CloudTrail enables visibility into AWS API calls that are being made in your AWS account.
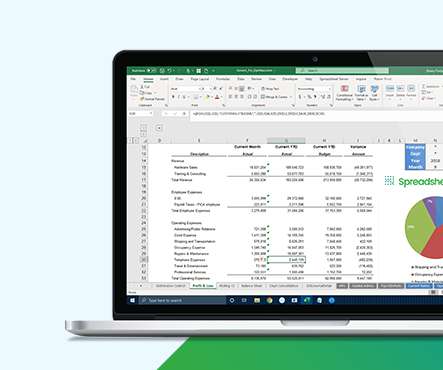
Enterprise Performance Management (EPM) provides users throughout your company with vivid, up-to-the-minute details about the key metrics that drive your organization’s success. This creates an opportunity-cost when decision makers have to wait for the reports they’ll be using to track performance metrics. Step 6: Drill Into the Data.
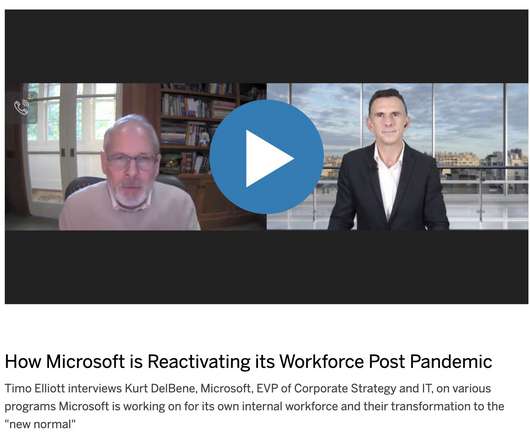
What you see here is a Power BI dashboard, and in this particular case, it’s a world view of the situation in terms of confirmed cases around the world, and you can drill in and you’ll see all the different countries in the world, and then you see a snapshot view on the right-hand side of what the case levels are around the world.
All of that in-between work–the export, the consolidation, and the cleanup–means that analysts are stuck using a snapshot of the data. Executives need to know how the organization is performing relative to key metrics, and how certain external factors may impact revenue product demand, profitability, supply chain performance, and more.
You’ll learn how leading finance teams apply technology to the task of producing fast, accurate reports, eliminating tedious manual effort, giving managers visibility to real-time organizational metrics, and instilling confidence in stakeholders throughout the company. Challenge 1. ERP Complexity.
For S3 backup bucket error output prefix , enter error/events-1/. On the Logging and metrics tab, choose Enable. Storage optimization You can manage storage overhead by removing older, unnecessary snapshots and their associated underlying files. For more information, refer to Route incoming records to different Iceberg Tables.
In the case that a cluster has failed and cant be recovered automatically, you have to initiate a restore of the cluster from a previous snapshot. By using Multi-AZ deployments, your Redshift data warehouse can continue operating in failure scenarios when an unexpected event happens in an Availability Zone.
Although this provides immediate consistency and simplifies reads (because readers only access the latest snapshot of the data), it can become costly and slow for write-heavy workloads due to the need for frequent rewrites. The following table shows some metrics of the Athena query performance.
We organize all of the trending information in your field so you don't have to. Join 42,000+ users and stay up to date on the latest articles your peers are reading.
You know about us, now we want to get to know you!
Let's personalize your content
Let's get even more personalized
We recognize your account from another site in our network, please click 'Send Email' below to continue with verifying your account and setting a password.


Let's personalize your content