This site uses cookies to improve your experience. To help us insure we adhere to various privacy regulations, please select your country/region of residence. If you do not select a country, we will assume you are from the United States. Select your Cookie Settings or view our Privacy Policy and Terms of Use.
Cookie Settings
Cookies and similar technologies are used on this website for proper function of the website, for tracking performance analytics and for marketing purposes. We and some of our third-party providers may use cookie data for various purposes. Please review the cookie settings below and choose your preference.
Used for the proper function of the website
Used for monitoring website traffic and interactions
Cookie Settings
Cookies and similar technologies are used on this website for proper function of the website, for tracking performance analytics and for marketing purposes. We and some of our third-party providers may use cookie data for various purposes. Please review the cookie settings below and choose your preference.
Strictly Necessary: Used for the proper function of the website
Performance/Analytics: Used for monitoring website traffic and interactions
Without clarity in metrics, it’s impossible to do meaningful experimentation. AI PMs must ensure that experimentation occurs during three phases of the product lifecycle: Phase 1: Concept During the concept phase, it’s important to determine if it’s even possible for an AI product “ intervention ” to move an upstream business metric.
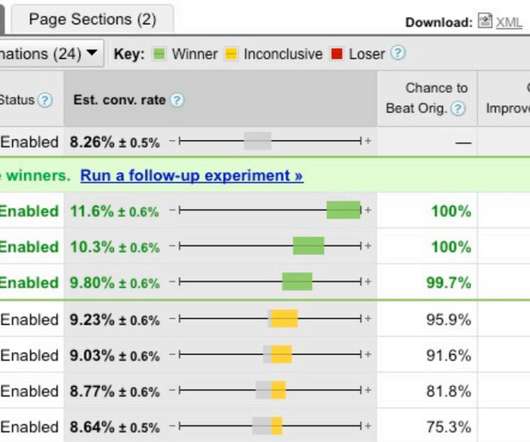
This post is a primer on the delightful world of testing and experimentation (A/B, Multivariate, and a new term from me: Experience Testing). Experimentation and testing help us figure out we are wrong, quickly and repeatedly and if you think about it that is a great thing for our customers, and for our employers. Counter claims?
Since you're reading a blog on advanced analytics, I'm going to assume that you have been exposed to the magical and amazing awesomeness of experimentation and testing. And yet, chances are you really don’t know anyone directly who uses experimentation as a part of their regular business practice. Wah wah wah waaah.
All you need to know for now is that machine learning uses statistical techniques to give computer systems the ability to “learn” by being trained on existing data. The need for an experimental culture implies that machine learning is currently better suited to the consumer space than it is to enterprise companies.
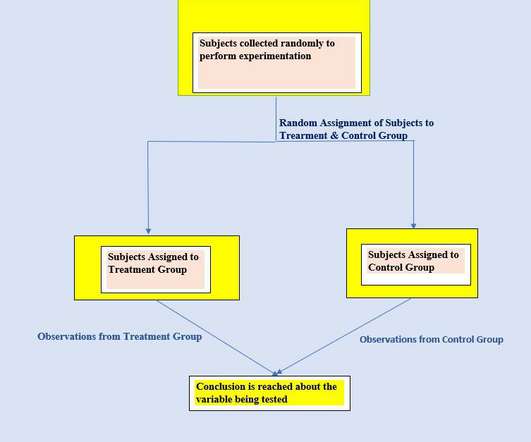
This: You understand all the environmental variables currently in play, you carefully choose more than one group of "like type" subjects, you expose them to a different mix of media, measure differences in outcomes, prove / disprove your hypothesis (DO FACEBOOK NOW!!!), Measuring Incrementality: Controlled Experiments to the Rescue!
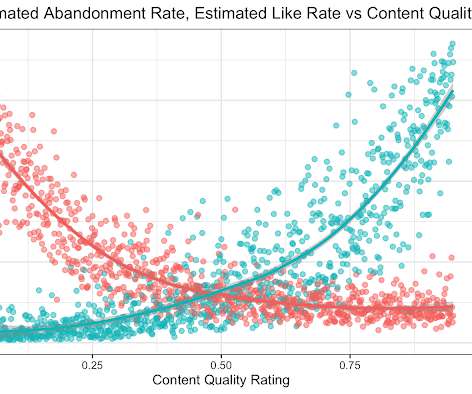
the weight given to Likes in our video recommendation algorithm) while $Y$ is a vector of outcome measures such as different metrics of user experience (e.g., Taking measurements at parameter settings further from control parameter settings leads to a lower variance estimate of the slope of the line relating the metric to the parameter.
Key To Your Digital Success: Web Analytics Measurement Model. " Measuring Incrementality: Controlled Experiments to the Rescue! Barriers To An Effective Web Measurement Strategy [+ Solutions!]. Measuring Online Engagement: What Role Does Web Analytics Play? "Engagement" How Do I Measure Success?
Computer Vision: Data Mining: Data Science: Application of scientific method to discovery from data (including Statistics, Machine Learning, data visualization, exploratory data analysis, experimentation, and more). They cannot process language inputs generally. Industry 4.0 Examples: (1) Automated manufacturing assembly line. (2)
We develop an ordinary least squares (OLS) linear regression model of equity returns using Statsmodels, a Python statistical package, to illustrate these three error types. CI theory was developed around 1937 by Jerzy Neyman, a mathematician and one of the principal architects of modern statistics.
Some of that uncertainty is the result of statistical inference, i.e., using a finite sample of observations for estimation. But there are other kinds of uncertainty, at least as important, that are not statistical in nature. Representational uncertainty : the gap between the desired meaning of some measure and its actual meaning.
Some pitfalls of this type of experimentation include: Suppose an experiment is performed to observe the relationship between the snack habit of a person while watching TV. Reliability: It means measurements should have repeatable results. For eg: you measure the blood pressure of a person. Statistics Essential for Dummies by D.
For example, imagine a fantasy football site is considering displaying advanced player statistics. A ramp-up strategy may mitigate the risk of upsetting the site’s loyal users who perhaps have strong preferences for the current statistics that are shown. One reason to do ramp-up is to mitigate the risk of never before seen arms.
Certifications measure your knowledge and skills against industry- and vendor-specific benchmarks to prove to employers that you have the right skillset. They should also have experience with pattern detection, experimentation in business, optimization techniques, and time series forecasting.
First, you figure out what you want to improve; then you create an experiment; then you run the experiment; then you measure the results and decide what to do. For each of them, write down the KPI you're measuring, and what that KPI should be for you to consider your efforts a success. Measure and decide what to do.
Part of it is fueled by a vocal minority genuinely upset that 10 years on we are still not a statistically powered bunch doing complicated analysis that is shifting paradigms. Part of it fueled by some Consultants. I suppose the rational is: self preservation before all else. It has simply not had a break to catch a breath and mature.
A 1958 Harvard Business Review article coined the term information technology, focusing their definition on rapidly processing large amounts of information, using statistical and mathematical methods in decision-making, and simulating higher order thinking through applications.
It wasn’t just a single measurement of particulates,” says Chris Mattmann, NASA JPL’s former chief technology and innovation officer. “It It was many measurements the agents collectively decided was either too many contaminants or not.” They also had extreme measurement sensitivity. It’s a system still being used today.
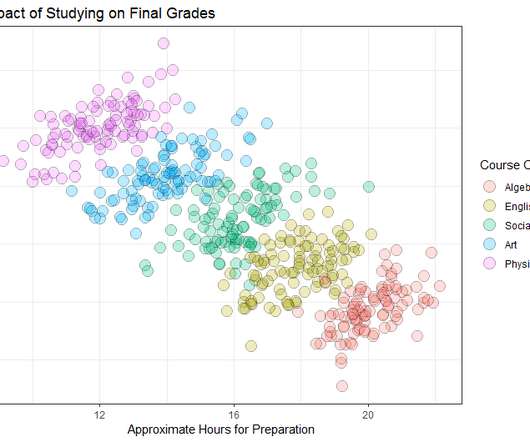
This is an example of Simpon’s paradox , a statistical phenomenon in which a trend that is present when data is put into groups reverses or disappears when the data is combined. It’s time to introduce a new statistical term. They measured both the blood pressure of the participants and if they had a heart attack or not.
Most companies are astonishingly blasé about data and possibilities of measurement. " Sad, unimaginative measurements of their sad, unimaginative campaigns. AND you can have analysis of your risk in almost real time to get an early read and in a few days with statistical significance! One of my biggest learnings?
by MICHAEL FORTE Large-scale live experimentation is a big part of online product development. This means a small and growing product has to use experimentation differently and very carefully. This blog post is about experimentation in this regime. But these are not usually amenable to A/B experimentation.
Unlike experimentation in some other areas, LSOS experiments present a surprising challenge to statisticians — even though we operate in the realm of “big data”, the statistical uncertainty in our experiments can be substantial. We must therefore maintain statistical rigor in quantifying experimental uncertainty.
But what if users don't immediately uptake the new experimental version? Background At Google, experimentation is an invaluable tool for making decisions and inference about new products and features. For example, we might want to stop the process if we measure harmful effects early. What if their uptake rate is not uniform?
Tokens ChatGPT’s sense of “context”—the amount of text that it considers when it’s in conversation—is measured in “tokens,” which are also used for billing. And it can look up an author and make statistical observations about their interests. Tokens are significant parts of a word.
The book focuses on randomised controlled trials and well-defined interventions as the basis of causal inference from both experimental and observational data. As the authors show, even with randomised experiments, the analysis often requires using observational causal inference tools due to factors like selection and measurement biases.
For example, P&C insurance strives to understand its customers and households better through data, to provide better customer service and anticipate insurance needs, as well as accurately measure risks. Life insurance needs accurate data on consumer health, age and other metrics of risk.
Skomoroch proposes that managing ML projects are challenging for organizations because shipping ML projects requires an experimental culture that fundamentally changes how many companies approach building and shipping software. These measurement-obsessed companies have an advantage when it comes to AI.
Experimentation on networks A/B testing is a standard method of measuring the effect of changes by randomizing samples into different treatment groups. With A/B testing, we can validate various hypotheses and measure the impact of our product changes, allowing us to make better decisions. This could create confusion.
For example, data measured by sensors can contain all kinds of noise due to sensor malfunctions, environmental changes, etc., If the various observed values measured by sensors in the equipment could be predicted, it would be possible to control manufacturing parameters and reduce fuel costs. which can lead to large prediction errors.
How do you measure its utility? As a statistical model, LLM inherently is random. Experimentation is important, but be explicit when you do. There’s a famous saying by a statistician, George Box, “All models are wrong, but some are useful.” ” So, how do you know whether your model is useful?
” Given the statistics—82% of surveyed respondents in a 2023 Statista study cited managing cloud spend as a significant challenge—it’s a legitimate concern. Cloud adoption maturity model This maturity model helps measure an organization’s cloud maturity in aggregate.
In this post we explore why some standard statistical techniques to reduce variance are often ineffective in this “data-rich, information-poor” realm. Despite a very large number of experimental units, the experiments conducted by LSOS cannot presume statistical significance of all effects they deem practically significant.
Visualizations are vital in data science work, with the caveat that the information that they convey may be 4-5 layers of abstraction away from the actual business process being measured. measure the subjects’ ability to trust the models’ results. Use of influence functions goes back to the 1970s in robust statistics.
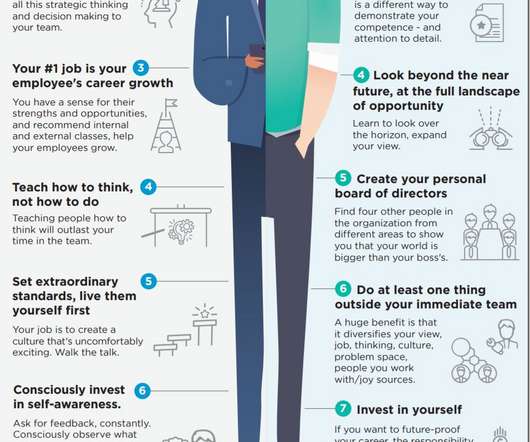
From observing behavior closely, and from my own experimentation and failure, I've noticed consistent patterns in what great employees do and great bosses do. They find the external author of the statistical algorithm I want them to use, and ask them for guidance. They do more research than is required. Invest in yourself.
As data science work is experimental and probabilistic in nature, data scientists are often faced with making inferences. You’ll measure this effect by looking at a quantity called the average treatment effect (ATE). What you really want to measure is the difference in outcomes. A complementary Domino project is available. .
To name a few: Digital Marketing & Measurement Model | Analytics Ecosystem | Web Analytics 2.0. During a discussion around planning for measurement, a peer was struggling with a unique collection of challenges. You see more digital metrics because digital is more measurable. Especially for the non-obvious problem #2 above.
Strip plots in the flesh: NPR looks at school funding The LA Times on pop music’s evolution Eurostat’s key European statistics Jittered Strip Plot. Choosing the right number of bins can have an impact on how any of these charts look, but a bit of experimentation usually leads to a reasonable answer.
The analysis can be straightforward, especially when it's safe to assume that individual observations of an outcome measure are independent. The outcome measure we care about is an average of the students' test scores, and so the unit of observation is a student. To figure this out, let's consider an appropriate experimental design.
Domino Lab supports both interactive and batch experimentation with all popular IDEs and notebooks (Jupyter, RStudio, SAS, Zeppelin, etc.). TIME – time points of measured pain score and plasma concentration (in hrs). We can group by study arm and calculate various statistics as mean and standard deviation. pain_df.TIME.==
It is important that we can measure the effect of these offline conversions as well. Panel studies make it possible to measure user behavior along with the exposure to ads and other online elements. Let's take a look at larger groups of individuals whose aggregate behavior we can measure. days or weeks).
In an ideal world, experimentation through randomization of the treatment assignment allows the identification and consistent estimation of causal effects. Identification We now discuss formally the statistical problem of causal inference. We start by describing the problem using standard statistical notation.
You’ll often see the name “data challenge” used when the take-home assignment involves machine learning or statistics or “coding challenge” when the focus is on evaluating a candidate’s software engineering skills. provide an opportunity to measure both. Length: Highly Variable.
It is important to make clear distinctions among each of these, and to advance the state of knowledge through concerted observation, modeling and experimentation. Note also that this account does not involve ambiguity due to statistical uncertainty. We sliced and diced the experimental data in many many ways.
LLMs like ChatGPT are trained on massive amounts of text data, allowing them to recognize patterns and statistical relationships within language. Achieving these feats is accomplished through a combination of sophisticated algorithms, natural language processing (NLP) and computer science principles.
Experimentation & Testing (A/B, Multivariate, you name it). If you have fifteen years of experience you'll still learn loads from chapters that cover holistic search analytics (internal, SEO, SEM/PPC) and Statistical Significance and Multi Channel Marketing Analytics and Advanced Conversion Rate measurement and more.
We organize all of the trending information in your field so you don't have to. Join 42,000+ users and stay up to date on the latest articles your peers are reading.
You know about us, now we want to get to know you!
Let's personalize your content
Let's get even more personalized
We recognize your account from another site in our network, please click 'Send Email' below to continue with verifying your account and setting a password.


Let's personalize your content