This site uses cookies to improve your experience. To help us insure we adhere to various privacy regulations, please select your country/region of residence. If you do not select a country, we will assume you are from the United States. Select your Cookie Settings or view our Privacy Policy and Terms of Use.
Cookie Settings
Cookies and similar technologies are used on this website for proper function of the website, for tracking performance analytics and for marketing purposes. We and some of our third-party providers may use cookie data for various purposes. Please review the cookie settings below and choose your preference.
Used for the proper function of the website
Used for monitoring website traffic and interactions
Cookie Settings
Cookies and similar technologies are used on this website for proper function of the website, for tracking performance analytics and for marketing purposes. We and some of our third-party providers may use cookie data for various purposes. Please review the cookie settings below and choose your preference.
Strictly Necessary: Used for the proper function of the website
Performance/Analytics: Used for monitoring website traffic and interactions
Technology should be viewed as an enabler of program success for diversity, equity, inclusion and belonging, providing extended support that enables teams to expand their reach and ability to execute more complex business processes. Rather than simply identifying the gaps, these systems provide actionable recommendations for HR to explore.
REA Group, a digital business that specializes in real estate property, solved this problem using Amazon Managed Streaming for Apache Kafka (Amazon MSK) and a data streaming platform called Hydro. REA Group’s team of more than 3,000 people is guided by our purpose: to change the way the world experiences property.
For CIOs leading enterprise transformations, portfolio health isnt just an operational indicator its a real-time pulse on time-to-market and resilience in a digital-first economy. Understanding and tracking the right software delivery metrics is essential to inform strategic decisions that drive continuous improvement.
It enables teams to securely find, prepare, and collaborate on data assets and build analytics and AI applications through a single experience, accelerating the path from data to value. At AWS re:Invent 2024, we announced the next generation of Amazon SageMaker , the center for all your data, analytics, and AI.
Data practitioners need to upgrade to the latest Spark releases to benefit from performance improvements, new features, bug fixes, and security enhancements. Starting with Spark jobs in AWS Glue , this feature allows you to upgrade from an older AWS Glue version to AWS Glue version 4.0. to Spark 3.3.0
“Software as a service” (SaaS) is becoming an increasingly viable choice for organizations looking for the accessibility and versatility of software solutions and online data analysis tools without the need to rely on installing and running applications on their own computer systems and data centers. SaaS is taking over the cloud computing market.
Today, Amazon Redshift is used by customers across all industries for a variety of use cases, including data warehouse migration and modernization, near real-time analytics, self-service analytics, data lake analytics, machine learning (ML), and data monetization.
Finally, modeling tools are improving, and automation is beginning to allow new users to tackle problems that used to be the province of experts. These ML development tools are designed specifically to help teams of developers, machine learning engineers , and data scientists collaborate, manage, and reproduce , ML experiments.
Tens of thousands of customers today rely on Amazon Redshift to analyze exabytes of data and run complex analytical queries, making it the most widely used cloud data warehouse. This post shows you how to build automatic file ingestion pipelines in Amazon Redshift when source files are located on Amazon S3 by using a simple SQL command.
You pull an open-source large language model (LLM) to train on your corporate data so that the marketing team can build better assets, and the customer service team can provide customer-facing chatbots. The next phase of this transformation requires an intelligent data infrastructure that can bring AI closer to enterprise data.
A solid ramp in initial interest puts a new medicine on a trajectory to meet its lifetime sales targets. A solid ramp in initial interest puts a new medicine on a trajectory to meet its lifetime sales targets. This analytics function is so crucial to product success that the data team often reports directly into sales and marketing.
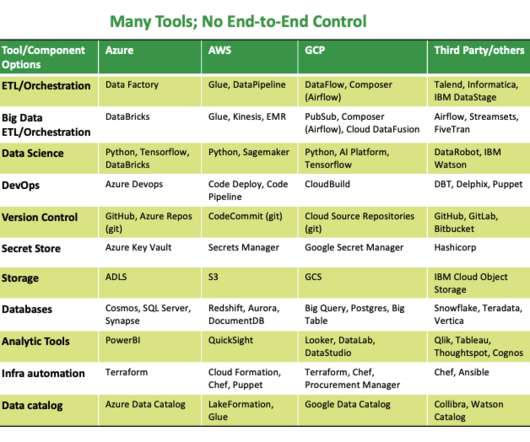
This is not surprising given that DataOps enables enterprise data teams to generate significant business value from their data. We have also included vendors for the specific use cases of ModelOps, MLOps, DataGovOps and DataSecOps which apply DataOps principles to machine learning, AI, data governance, and data security operations. .
Share the essential business intelligence trends among your team! It is not only important to gather as much information possible, but the quality and the context in which data is being used and interpreted serves as the main focus for the future of business intelligence. Data exploded and became big. 1) Data Quality Management (DQM).
The ability of cloud infrastructure to adapt, scale and be malleable to meet business needs right where they are and then enable them to expand makes it the default choice. As organizations increasingly migrate to the cloud, however, CIOs face the daunting challenge of navigating a complex and rapidly evolving cloud ecosystem.
Here are just a few examples of the benefits of using LLMs in the enterprise for both internal and external use cases: Optimize Costs. LLMs deployed as code assistants accelerate developer efficiency within an organization, ensuring that code meets standards and coding best practices. Increase Productivity.
In this post, we will explain what is a KPI scorecard, when to use it, what is the difference between scorecard and dashboard, and KPI scorecard examples and templates from business scenarios that can be applied to different departments and organizations or used as a roadmap for online data analysis. Traditional scorecard.
When there is a problem in data pipelines, data engineers are expected to fix it using ad hoc processes that simply will not scale. If data pipelines span teams, then there is an unpleasant (and often political) discovery phase where people may point fingers at each other. Gartner estimated that 85% of big data projects fail.
At Hedged Capital , an AI-first financial trading and advisory firm, we use probabilistic models to trade the financial markets. Used with permission. Models are used to simplify the complexity of the real world, thus enabling us to focus on the features of a phenomenon that interests us.
That being said, in this post, we will explain what is a dashboard in business, the features of strategic, tactical, operational and analytical dashboards, and expound on examples that these different types of dashboards can be used. But what do you do with all this business intelligence? Let’s get started.
Communal devices are intended to be used by groups of people in homes and offices. The telephone in the kitchen was for everyone’s use. That’s precisely where we’re wrong: they’re not edge cases, but they’re at the core of how people want to use these devices. We, as users, have certain expectations for what a device should do.
Like many large financial institutions, ANZ Institutional Division operated with siloed data practices and centralized data management teams. In today’s rapidly evolving financial landscape, data is the bedrock of innovation, enhancing customer and employee experiences and securing a competitive edge.
Over the next several weeks, we’ll explore the Cloudera AI Inference service in-depth, providing you with a comprehensive introduction to its capabilities, benefits, and use cases. Welcome to the first installment of a series of posts discussing the recently announced Cloudera AI Inference service. Why did we build it?
For instance, about 62% of US employees from 22 to 65 years old say they work out of the office at least sometimes today. As we stated in a previous post, cloud technology has made remote teams possible. Microsoft has an article detailing the many benefits of using the cloud for video conferencing. Key iMind.com Features.
Data is all around us. How Data Dashboards Are Used In BI. According to the EMC Digital Universe study, by 2020, around 40 trillion megabytes – or 40 zettabytes – will exist in our digital landscape. That’s an unfathomable amount of information. Let’s kick things off by asking the question: what is a data dashboard?
Although traditional scaling primarily responds to query queue times, the new AI-driven scaling and optimization feature offers a more sophisticated approach by considering multiple factors including query complexity and data volume. Consider using AI-driven scaling and optimization if your current workload requires 32 to 512 base RPUs.
In enterprises, we’ve seen everything from wholesale adoption to policies that severely restrict or even forbid the use of generative AI. Our survey focused on how companies use generative AI, what bottlenecks they see in adoption, and what skills gaps need to be addressed. Generative AI has been the biggest technology story of 2023.
Take a comfortable seat, enjoy the power of interactive business dashboards , leave your spreadsheets behind, and utilize the advantages of interactive dashboard design and its features. Soon businesses of all sizes will have so much amount of information that dashboard software will be the most invaluable resource a company can have.
Meet FRED, a 33-year-old data tool from St. FRED uses data from trusted sources such as the BLS and US Census. FRED uses data from trusted sources such as the BLS and US Census. Commenters rave about being able to save graphs that they can use in their discussions. Why does FRED break through? Credibility.
Digital data is all around us. We will explain the ad hoc reporting meaning, benefits, uses in the real world, but first, let’s start with the ad hoc reporting definition. And this lies in the essence of the ad hoc reporting definition; providing quick reports for single-use, without generating complicated SQL queries. .
Moreover, companies that use BI analytics are five times more likely to make swifter, more informed decisions. Table of Contents. 1) Why Shift To A BI Career? 2) Top 10 Necessary BI Skills. 3) What Are the First Steps To Getting Started? 4) Business Intelligence Job Roles. 5) Main Challenges Of A BI Career. 6) Main Players In The BI Industry.
Tech companies have laid off over 250 thousand employees since 2022, and 93% of CEOs report preparing for a US recession over the next 12 to 18 months. Tech companies have laid off over 250 thousand employees since 2022, and 93% of CEOs report preparing for a US recession over the next 12 to 18 months.
This is where the need to use a report tool and monitor when all of these little and big changes arise: knowing what is happening in your business is key to keep it afloat and be prepared to face any transformation or drastic shift. To understand the best uses for business reports it’s essential to properly define these kinds of reports.
During meetings with customers, salespeople had to juggle up to four different siloed tools to access data on premises and in the cloud. In addition, they needed standardized processes during sales meetings that would populate the CRM with the right data. It also bottles the Pepsi range of products for PepsiCo in New Zealand.
That said, data and analytics are only valuable if you know how to use them to your advantage. The data and analytics environment can be challenging to navigate, and having the right supportive tools in place can help companies gain the insights they need to meet, and even exceed, their goals. 2) What Is Embedded BI? million per year.
While traditional extract, transform, and load (ETL) processes have long been a staple of data integration due to its flexibility, for common use cases such as replication and ingestion, they often prove time-consuming, complex, and less adaptable to the fast-changing demands of modern data architectures.
Offering a work-from-home option is no longer negotiable if you want to keep your teams staffed with talented employees. That’s a jump from a post-pandemic Gartner study , which found that 39% of US adults would leave their job if remote work were no longer permitted. They even miss in-person meetings. We just sucked at it.”
These AI assistants often use the term copilot to indicate how generative AI capabilities embedded in workflow tools can augment and assist people in performing tasks and prompting for information more efficiently. GitHub first launched its copilot in 2021 , and Microsoft 365 Copilot became generally available a few months ago.
Meet the language of emergency room triage notes. That happens because that’s how doctors will answer if you ask them what language they use. None of them use the words “patient” or “pain.” They use a lot of jargon: 10/10 refers to the intensity of pain. are written in English. They don’t have a subject.
German healthcare company Fresenius Medical Care, which specializes in providing kidney dialysis services, is using a combination of near real-time IoT data and clinical data to predict one of the most common complications of the procedure. Hemodialysis is a life-saving treatment for those suffering from kidney failure.
This allowed us to have disaggregated storage and compute layers, independently scaling based on workload requirements. A flexible orchestration tool that enables easier automation, dependency management, and customization — like Apache Airflow — is needed to meet the evolving needs of organizations large and small. New in 2021.
Observability is a methodology for providing visibility of every journey that data takes from source to customer value across every tool, environment, data store, team, and customer so that problems are detected and addressed immediately. Jason is the CDO for Company X, responsible for six teams of data professionals across several locations.
Das’s biggest priorities include integrating Randall-Reilly IT with client systems to become more essential to their businesses, rearchitecting old systems using modern approaches such as microservices, implementing AI and machine learning to automate manual processes, and delivering clean, standardized data for analytics and monitoring.
But despite the bumpy year, demand for technology skills remains strong, with the US tech unemployment rate dropping to 1.5% Finally, the director of IT is tasked with managing specific teams or departments within IT operations, often including development teams and help desk support. as of January. increase from 2021.
The Syntax, Semantics, and Pragmatics Gap in Data Quality Validate Testing Data Teams often have too many things on their ‘to-do’ list. They have a backlog full of new customer features or data requests, and they go to work every day knowing that they won’t and can’t meet customer expectations.
We organize all of the trending information in your field so you don't have to. Join 42,000+ users and stay up to date on the latest articles your peers are reading.
You know about us, now we want to get to know you!
Let's personalize your content
Let's get even more personalized
We recognize your account from another site in our network, please click 'Send Email' below to continue with verifying your account and setting a password.


Let's personalize your content