This site uses cookies to improve your experience. To help us insure we adhere to various privacy regulations, please select your country/region of residence. If you do not select a country, we will assume you are from the United States. Select your Cookie Settings or view our Privacy Policy and Terms of Use.
Cookie Settings
Cookies and similar technologies are used on this website for proper function of the website, for tracking performance analytics and for marketing purposes. We and some of our third-party providers may use cookie data for various purposes. Please review the cookie settings below and choose your preference.
Used for the proper function of the website
Used for monitoring website traffic and interactions
Cookie Settings
Cookies and similar technologies are used on this website for proper function of the website, for tracking performance analytics and for marketing purposes. We and some of our third-party providers may use cookie data for various purposes. Please review the cookie settings below and choose your preference.
Strictly Necessary: Used for the proper function of the website
Performance/Analytics: Used for monitoring website traffic and interactions
Big data plays a crucial role in online data analysis , business information, and intelligent reporting. That’s where business intelligence reporting comes into play – and, indeed, is proving pivotal in empowering organizations to collect data effectively and transform insight into action. What Is BI Reporting?
Table of Contents 1) What Is A Performance Report? 2) The Importance of Performance Reports 3) Performance Report Examples 4) Performance Reporting Tips Performance reporting has been a traditional business practice for decades now. At the time, this was not an issue, as the static nature of reporting was the norm.
there are two answers that go hand in hand: good exploitation of your analytics, that come from the results of a market research report. Your Chance: Want to test a market research reporting software? Explore our 14 day free trial & benefit from market research reports! What Is A Market Research Report?
1) What Are Accounting Reports? 2) Why Do You Need Accounting Reports? 3) Types Of Accounting Reports. 4) Accounting Reports Examples. 5) The Role Of Visuals In Accountant Reports. On the basis of every company’s competent management, we can find accounting reports. What Are Accounting Reports?
Moreover, within just five years, the number of smart connected devices in the world will amount to more than 22 billion – all of which will produce colossal sets of collectible, curatable, and analyzable data, claimed IoT Analytics in their industry report. One of the most effective means of doing this is by utilizing KPI reporting tools.
In one example, BNY Mellon is deploying NVIDIAs DGX SuperPOD AI supercomputer to enable AI-enabled applications, including deposit forecasting, payment automation, predictive trade analytics, and end-of-day cash balances. Whats more, three quarters consider their AI capabilities to be ahead of or right in line with their peers.
In essence, in this post, we will explain all the details needed for dashboard reporting and creation, compare interactive vs. static reporting, and provide tips and tricks to make your business perform even better. Interactive Dashboards vs. Static Reporting. Let’s get started.
Table of Contents 1) What Is The Report Definition? 2) Top 14 Types Of Reports 3) What Does A Report Look Like? Businesses have been producing reports since, forever. This presents a problem for many modern organizations today as building reports can take from hours to days. What Is The Report Definition?
A Fan Chart is a visualisation tool used in time series analysis to display forecasts and associated uncertainties. Also, as the forecast extends further into the future, uncertainty grows, causing the shaded areas to widen and give this chart its distinctive ‘fan’ appearance.
One of the most important is collecting revenue data to draft financial statements, forecast future sales and make decisions to address revenue shortfalls. After aggregating data, you can create a sales report with ODBC. Merging Excel with Data Mining Technology Can Help You Create Stellar Sales Reports.
Many businesses use different software tools to analyze historical data and past patterns to forecast future demand and trends to make more accurate financial, marketing, and operational decisions. Forecasting acts as a planning tool to help enterprises prepare for the uncertainty that can occur in the future.
operator of 28 hotel and casino properties across the US, was negotiating a fresh enterprise agreement with VMware prior to its acquisition, reported The Register. The main requirement is having an Azure landing zone, and then you can build whatever service that you want on it,” he told The Forecast. “I I think the world is changing.”
Our legacy architecture consisted of multiple standalone, on-prem data marts intended to integrate transactional data from roughly 30 electronic health record systems to deliver a reporting capability. We had plenty of reporting, but very little data insight, and no real semblance of a data strategy. How is the new platform helping?
The development of business intelligence to analyze and extract value from the countless sources of data that we gather at a high scale, brought alongside a bunch of errors and low-quality reports: the disparity of data sources and data types added some more complexity to the data integration process. 3) Artificial Intelligence.
This allows users to make better decisions in various domains, from supply chain and logistics, to sustainability reporting and more. Our software enables users to perform their tasks more efficiently, and with AI, the programs become smarter, faster, and more insightful. SAP also attracts a lot of new talent.
Wei attributed the delays at TSMCs Arizona factory to a combination of complex compliance requirements, local construction regulations, and extensive permitting processes, according to a Reuters report. Reports now indicate production has already started. The US government has extended robust support to TSMCs investment, offering a $6.6
When asked what holds back the adoption of machine learning and AI, survey respondents for our upcoming report, “Evolving Data Infrastructure,” cited “company culture” and “difficulties in identifying appropriate business use cases” among the leading reasons. Forecasting Financial Time Series with Deep Learning on Azure”.
They can also automate report generation and interpret data nuances that traditional methods might miss. Imagine such a system processing unstructured text data like historical maintenance logs, technician notes, defect reports and warranty claims, and correlating it with structured sensor data such as IoT readings and machine telemetry.
The software streamlines collecting data for planning and reporting and facilitates assigning responsibility within an enterprise to achieve ESG-related objectives. To reduce compliance burdens, it facilitates auditable reporting and provides executives and managers with the means to monitor performance to ESG commitments.
According to AI at Wartons report on navigating gen AIs early years, 72% of enterprises predict gen AI budget growth over the next 12 months but slower increases over the next two to five years. Compounding these data segments results in smarter recommendations with lead scoring, sales forecasting, churn prediction, and better analytics.
from last year, according to a market research report by Gartner. Driven by the ongoing need for companies to automate repetitive tasks, global RPA (robotic process automation) software revenue is expected to reach $2.9 billion in 2022, up by 19.5%
AI at Wharton reports enterprises increased their gen AI investments in 2024 by 2.3 times compared to 2023 but forecasts lower increases over the next two to five years. The report shows portfolio consolidation and integration investments over the past year, yet only 32% claim that over 80% of their marketing stack is integrated.
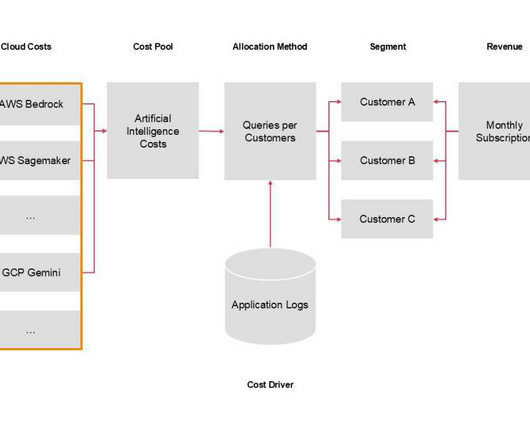
As cloud spending rises due to AI and other emerging technologies, Cloud FinOps has become essential for managing, forecasting, and optimising costs. Having built the model, the next step would be to build an enduring solution that can periodically report on Unit Economics.
SaaS is less robust and less secure than on-premises applications: Despite some SaaS-based teething problems or technical issues reported by the likes of Google, these occurrences are incredibly rare with software as a service applications – and there hasn’t been one major compromise of a SaaS operation documented to date.
Ryan Garnett, Senior Manager Business Solutions of Halifax International Airport Authority, joined The AI Forecast to share how the airport revamped its approach to data, creating a predictions engine that drives operational efficiency and improved customer experience. For example, we send routine reports to the senior leadership team.
The research finds the greatest inclination to spend is in sales performance management, which I interpret to mean that the participants see this area as having the highest potential to generate profit through gains in sales productivity and, therefore, increase revenue.
Enterprises that adopt RPA report reductions in process cycle times and operational costs. Automated processes also contribute to a more predictable operational environment that facilitates better planning and forecasting.
For this purpose, you should be able to differentiate between various charts and report types as well as understand when and how to use them to benefit the BI process. They can help a company forecast demand, or anticipate fraud. SAS BI: SAS can be considered the “mother” of all BI tools.
AI is also making it easier for executives and managers to rapidly forecast, plan and analyze to promote deeper situational awareness and facilitate better-informed decision-making. The next important step is creating an enterprise planning and reporting database of record. This can save budget owners time and shorten planning cycles.
Marsh McLennan has been using ML algorithms for several years for forecasting, anomaly detection, and image recognition in claims processing. Compounding this risk is a new and poorly understood factor: the potential for AI to amplify political misinformation and disinformation.
As of November 2023: Two-thirds (67%) of our survey respondents report that their companies are using generative AI. Two-thirds of our survey’s respondents (67%) report that their companies are using generative AI. And only 33% report that their companies aren’t using AI at all. Certainly not two-thirds of them.
Reports state that the revenue generated in the ‘Tea’ segment of the hot drinks market in India was forecast to continuously increase from now to 2029 by a total of 9.7 From being the beverage of royalty to the comfort of millions, tea’s burgeoning production has made it an economical choice. billion U.S. billion U.S.
This analytics function is so crucial to product success that the data team often reports directly into sales and marketing. Figure 2: During the product launch, data comes from various sources and feeds into regular and ad hoc reports and analytics. New data is shared with users by updating reporting schema several times a day.
Salesforces recent State of Commerce report found that 80% of eCommerce businesses already leverage AI solutions. According to Retail Doctor Groups latest research , Australian retailers demonstrate a sophisticated understanding of AI applications, particularly in personalisation, demand forecasting, and supply chain optimisation.
When financial data is inconsistent, reporting becomes unreliable. A compliance report is rejected because timestamps dont match across systems. In retail, poor product master data skews demand forecasts and disrupts fulfillment. Compliance-heavy environments, enterprise reporting. Embed end-to-end lineage tracking.
Viole Kastrati: Without systematic and continuous reporting, it is almost impossible to get a complete picture of the personnel situation and make informed decisions based on it. Human resources must also contribute to transparent reporting requirements here. Subsequently, the reporting should be set up properly.
Business intelligence architecture is a term used to describe standards and policies for organizing data with the help of computer-based techniques and technologies that create business intelligence systems used for online data visualization , reporting, and analysis. One of the BI architecture components is data warehousing.
In a business context, this method identifies patterns and trends and can forecast inventory, predict customer responses to new products, assess risks, among others. One day you are looking at your sales report and notice that sales for a pair of red shoes have spiked in the past weeks in New York. Usage in a business context.
-based company, which claims to be the top-ranked supplier of renewable energy sales to corporations, turned to machine learning to help forecast renewable asset output, while establishing an automation framework for streamlining the company’s operations in servicing the renewable energy market. million in its first year, contributed a $5.5
Epicor Grow AI applications include multiple capabilities such as inventory forecasting, AI generated sales orders from emails, personalized product suggestions based on order history, predictive maintenance recommendations for fleets, and more, within the context of familiar Epicor products.
Hot technologies for banks also include 5G , natural language processing (NLP) , microservices architecture , and computer vision, according to Forrester’s recent Top Emerging Technologies in Banking In 2022 report. AI enhances operational efficiency. 5G aids customer service. 5G aids customer service. 5G aids customer service.
Many users also report its power in constructed-in capabilities and libraries, data manipulation, and reporting. The example above shows us a visual of the drag and drop interface created in datapine for a 6 months forecast based on past and current data. Source: mathworks.com.
Marsh McLellan has been using ML algorithms for several years for forecasting, anomaly detection, and image recognition in claims processing. Compounding this risk is a new and poorly understood factor: the potential for AI to amplify political misinformation and disinformation.
There is a wealth of research showing again and again that evidence-based algorithms are more accurate than forecasts made by humans. People are much more likely to choose to use human rather than algorithmic forecasts once they have seen an algorithm perform and learned it is imperfect.
We organize all of the trending information in your field so you don't have to. Join 42,000+ users and stay up to date on the latest articles your peers are reading.
You know about us, now we want to get to know you!
Let's personalize your content
Let's get even more personalized
We recognize your account from another site in our network, please click 'Send Email' below to continue with verifying your account and setting a password.


Let's personalize your content