This site uses cookies to improve your experience. To help us insure we adhere to various privacy regulations, please select your country/region of residence. If you do not select a country, we will assume you are from the United States. Select your Cookie Settings or view our Privacy Policy and Terms of Use.
Cookie Settings
Cookies and similar technologies are used on this website for proper function of the website, for tracking performance analytics and for marketing purposes. We and some of our third-party providers may use cookie data for various purposes. Please review the cookie settings below and choose your preference.
Used for the proper function of the website
Used for monitoring website traffic and interactions
Cookie Settings
Cookies and similar technologies are used on this website for proper function of the website, for tracking performance analytics and for marketing purposes. We and some of our third-party providers may use cookie data for various purposes. Please review the cookie settings below and choose your preference.
Strictly Necessary: Used for the proper function of the website
Performance/Analytics: Used for monitoring website traffic and interactions
Introduction Time series forecasting is a really important area of Machine Learning as it gives you the ability to “see” ahead of time and. The post Time Series Forecasting using Microsoft Power BI appeared first on Analytics Vidhya.
This article was published as a part of the Data Science Blogathon Introduction Hello everyone, in this article we will pick the use case of sequence modelling, which is time series forecasting. The post Web Traffic Forecasting Using Deep Learning appeared first on Analytics Vidhya.
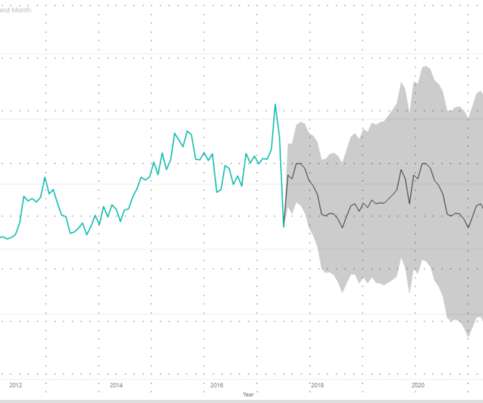
This article was published as a part of the Data Science Blogathon. Introduction Time series forecasting is used to predict future values based on previously. The post Stock Market Price Trend Prediction Using Time Series Forecasting appeared first on Analytics Vidhya.
ArticleVideo Book This article was published as a part of the Data Science Blogathon. The post Time Series Analysis: Forecast COVID-19 Vaccination Rate appeared first on Analytics Vidhya. Introduction In the current scenario of the COVID-19 pandemic, many.
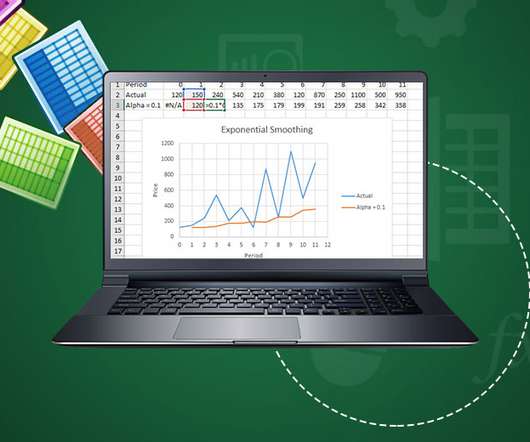
Overview Excel is the perfect fit for building your time series forecasting models We’ll discuss exponential smoothing models for time series forecasting, including the. Learn Exponential Smoothing Models for Time Series Forecasting in Excel appeared first on Analytics Vidhya. The post Time Series in Excel!
ArticleVideo Book This article was published as a part of the Data Science Blogathon. ” The post Automate Time Series Forecasting using Auto-TS appeared first on Analytics Vidhya. “Prediction is very difficult, especially if it’s about the future.”
This article was published as a part of the Data Science Blogathon. Introduction A popular and widely used statistical method for time series forecasting. The post How to Create an ARIMA Model for Time Series Forecasting in Python appeared first on Analytics Vidhya.
Overview This article will see how to create a stacked sequence to sequence the LSTM model for time series forecasting in Keras/ TF 2.0. . The post Multivariate Multi-step Time Series Forecasting using Stacked LSTM sequence to sequence Autoencoder in Tensorflow 2.0 / Keras appeared first on Analytics Vidhya.
This article was published as a part of the Data Science Blogathon. The post Examining the Simple Linear Regression method for forecasting stock prices using Excel appeared first on Analytics Vidhya. Introduction Even though there are myriad complex methods and systems aimed at.
For example, at a company providing manufacturing technology services, the priority was predicting sales opportunities, while at a company that designs and manufactures automatic test equipment (ATE), it was developing a platform for equipment production automation that relied heavily on forecasting. And guess what?
ArticleVideos This article was published as a part of the Data Science Blogathon. INTRODUCTION Stock prediction is the act of forecasting the future value. The post Modelling stock price using financial ratios and its applications to make buy/sell/hold decisions appeared first on Analytics Vidhya.
This article was published as a part of the Data Science Blogathon Introduction: Artificial Neural Networks (ANN) are algorithms based on brain function and are used to model complicated patterns and forecast issues. The […]. The post Introduction to Artificial Neural Networks appeared first on Analytics Vidhya.
Soumya Seetharam, CDIO at Corning, said the manufacturer has been on its data journey for a few years, with more than 70% of its business transaction data being ingested into a data platform. But that’s only structureddata, she emphasized.
The market for data warehouses is booming. One study forecasts that the market will be worth $23.8 While there is a lot of discussion about the merits of data warehouses, not enough discussion centers around data lakes. We talked about enterprise data warehouses in the past, so let’s contrast them with data lakes.
We’re leveraging the large graphical models with complex structureddata, establishing those interrelationships causation and correlation,” McGuinness says. MakeShift joins companies such as Medico, HSBC, Spirit Halloween, Taager.com, Future Metals, and WIO in deploying Ikigai Labs’ no-code models for tabular and time-series data.
They emphasize access to and manipulation of large databases of structureddata, often a time-series of internal company data and sometimes external data. Forecasting models. XLSTAT is an Excel data analysis add-on geared for corporate users and researchers. Model-driven DSS. Optimization analysis models.
ArticleVideo Book This article was published as a part of the Data Science Blogathon Introduction The purpose of this article is to understand what is granger. The post Granger Causality in Time Series – Explained using Chicken and Egg problem appeared first on Analytics Vidhya.
ArticleVideo Book This article was published as a part of the Data Science Blogathon Index Introduction Understanding Bitcoin Technologies used Getting real-time cryptocurrency data (bitcoin). The post Bitcoin Price Prediction Using Recurrent Neural Networks and LSTM appeared first on Analytics Vidhya.
ArticleVideo Book This article was published as a part of the Data Science Blogathon Introduction to Time Series Analysis Time Series Analysis is the. The post Holt Winter’s Method for Time Series Analysis appeared first on Analytics Vidhya.
Big data algorithms that understand these principles can use them to forecast the direction of the stock market. Progress made in computing and analytics has enabled financial experts to analyze data that was impossible to analyze a decade ago. Ten years ago, computers used to focus on analyzing structureddata alone.
The data lakehouse is a relatively new data architecture concept, first championed by Cloudera, which offers both storage and analytics capabilities as part of the same solution, in contrast to the concepts for data lake and data warehouse which, respectively, store data in native format, and structureddata, often in SQL format.
To keep up, Redmond formed a steering committee to identify opportunities based on business objectives, and whittled a long list of prospective projects down to about a dozen that range from inventory and supply chain management to sales forecasting. “We We don’t want to just go off to the next shiny object,” she says. “We
Data has always been central to agile business planning, forecasting and analysis – all tools which have become central to the modern CFO role. To enable this, Teradata’s multi-cloud software integrates data fast across finance systems – such as Oracle, PeopleSoft, and SAP – to connect and integrate in near real-time.
For a model-driven enterprise, having access to the appropriate tools can mean the difference between operating at a loss with a string of late projects lingering ahead of you or exceeding productivity and profitability forecasts. It’s most helpful in analyzing structureddata. This is no exaggeration by any means.
ArticleVideos This article was published as a part of the Data Science Blogathon. Introduction Time series is a series of data that are gathered. The post Visualization in Time Series using Heatmaps in Python appeared first on Analytics Vidhya.
The rising demand for data analysts The data analyst role is in high demand, as organizations are growing their analytics capabilities at a rapid clip. In July 2023, IDC forecast big data and analytics software revenue would hit $122.3 Data analyst role Data analysts mostly work with an organization’s structureddata.
Switching to IBM Business Analytics gave Jabil the ability to gather and structuredata in a centralized approach for management. The integrated solution plays a role in reporting, analysis, planning and forecasting. The portfolio contributes to the efficient management of their incredibly complex supply chain.
Building a robust data platform can transform the way manufacturers handle their customers and supplies. Not only are real-time results available, but big data can also provide demand forecasts to guide the production chain based on historical data sales trends in order to stay on top of the demand.
The evolution of AI and the use of structured and unstructured data When discriminative AI rose to prominence in sectors such as banking, healthcare, retail, and manufacturing, it was primarily trained on and used to analyze, classify, or make predictions about unstructured data.
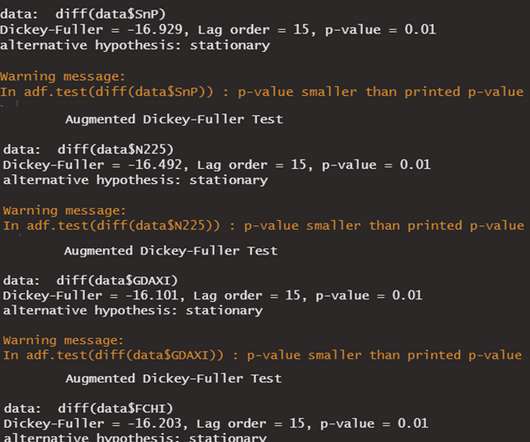
ArticleVideo Book This article was published as a part of the Data Science Blogathon. The post How to check Stationarity of Data in Python appeared first on Analytics Vidhya. Introduction Hello readers! In our routine life, we come.
The International Data Corporation (IDC) estimates that by 2025 the sum of all data in the world will be in the order of 175 Zettabytes (one Zettabyte is 10^21 bytes). Most of that data will be unstructured, and only about 10% will be stored. Less will be analysed.
ArticleVideo Book This article was published as a part of the Data Science Blogathon Introduction Cutting straight right to the chase, Hurst exponent is a. The post Using Hurst Exponent to analyse the Stock and Crypto market with Python appeared first on Analytics Vidhya.
Selling the value of data transformation Iyengar and his team are 18 months into a three- to five-year journey that started by building out the data layer — corralling data sources such as ERP, CRM, and legacy databases into data warehouses for structureddata and data lakes for unstructured data.
ArticleVideo Book This article was published as a part of the Data Science Blogathon. Introduction: Hello Readers! Ever wonder what are the factors which. The post Impact of Global Stock Market on Indian stock Index in R appeared first on Analytics Vidhya.
Overview: Data science vs data analytics Think of data science as the overarching umbrella that covers a wide range of tasks performed to find patterns in large datasets, structuredata for use, train machine learning models and develop artificial intelligence (AI) applications.
“The cloud data platform enables a data marketplace where organizations can obtain secure and governed consumer and government data, such as COVID-19 data, to make timely decisions in challenging times.”. In short, cloud data warehouses and BI platforms have revolutionized the way organizations share and use data.
Except for the rows and columns, you can also display your data through graphs and charts. For more advanced data analysis, Excel provides you with pivot tables, enabling you to analyze structureddata through multiple dimensions quickly and effectively. SAS Forecasting. From SAS Forecast Server. From KNIME.
Users themselves drag and drop data from different sources to create analysis models, and then the system automatically processes the data through intelligent analysis and automatic correlation, including structureddata and unstructured data.
With this zero-ETL approach, Amazon Redshift Streaming Ingestion enables you to connect to multiple Kinesis data streams or Amazon Managed Streaming for Apache Kafka (Amazon MSK) data streams and pull data directly to Amazon Redshift without staging data in Amazon Simple Storage Service (Amazon S3).
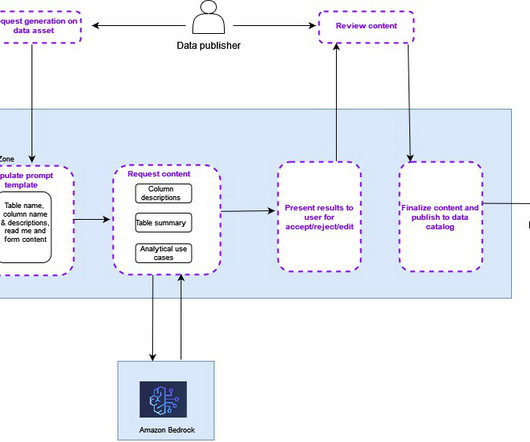
Without the right metadata and documentation, data consumers overlook valuable datasets relevant to their use case or spend more time going back and forth with data producers to understand the data and its relevance for their use case—or worse, misuse the data for a purpose it was not intended for.
AI helps address this problem by combining aspects like demand forecasting, last – mile delivery , and routing optimization. This use case shows how AI can help by processing unstructured image and video data in addition to structureddata in the previous examples.
Furthermore, AI algorithms’ capacity for recognizing patterns—by learning from your company’s unique historical data—can empower businesses to predict new trends and spot anomalies sooner and with low latency.
ArticleVideo Book This article was published as a part of the Data Science Blogathon Time series data consists of a set of observations in which. The post Working with Stock Market Time Series Data using Facebook Prophet appeared first on Analytics Vidhya.
We’re going to nerd out for a minute and dig into the evolving architecture of Sisense to illustrate some elements of the data modeling process: Historically, the data modeling process that Sisense recommended was to structuredata mainly to support the BI and analytics capabilities/users.
We organize all of the trending information in your field so you don't have to. Join 42,000+ users and stay up to date on the latest articles your peers are reading.
You know about us, now we want to get to know you!
Let's personalize your content
Let's get even more personalized
We recognize your account from another site in our network, please click 'Send Email' below to continue with verifying your account and setting a password.


Let's personalize your content