
KitikiPlot: Your New Go-To for Time-Series Data Visualization
Analytics Vidhya
DECEMBER 11, 2024
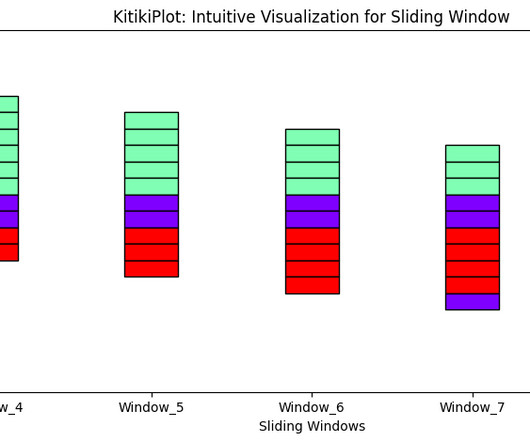
Introducing KitikiPlot, a Python library designed for visualizing sequential and time-series categorical “Sliding Window” patterns.
Analytics Vidhya
DECEMBER 11, 2024
Introducing KitikiPlot, a Python library designed for visualizing sequential and time-series categorical “Sliding Window” patterns.
Analytics Vidhya
JULY 9, 2020
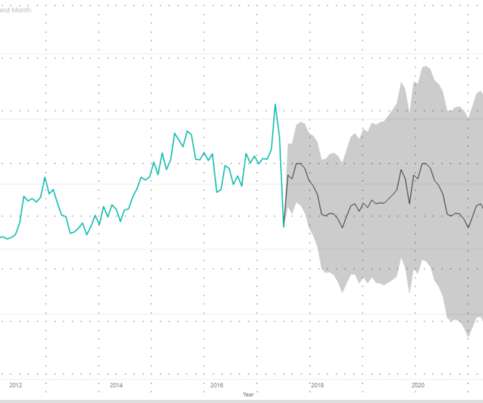
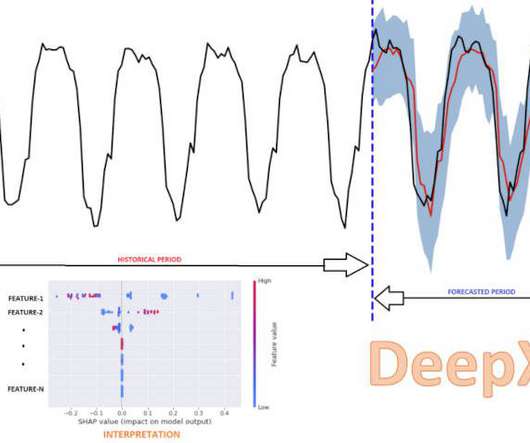
Introduction Time series forecasting is a really important area of Machine Learning as it gives you the ability to “see” ahead of time and. The post Time Series Forecasting using Microsoft Power BI appeared first on Analytics Vidhya.
This site is protected by reCAPTCHA and the Google Privacy Policy and Terms of Service apply.
Analytics Vidhya
APRIL 30, 2021
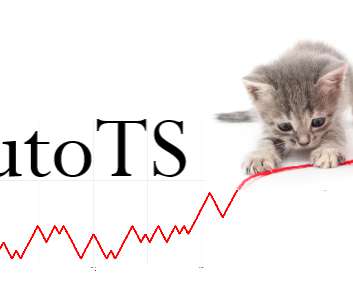
” The post Automate Time Series Forecasting using Auto-TS appeared first on Analytics Vidhya. ArticleVideo Book This article was published as a part of the Data Science Blogathon. “Prediction is very difficult, especially if it’s about the future.”
Analytics Vidhya
FEBRUARY 23, 2021
The post Visualization in Time Series using Heatmaps in Python appeared first on Analytics Vidhya. ArticleVideos This article was published as a part of the Data Science Blogathon. Introduction Time series is a series of data that are gathered.

datapine
JUNE 29, 2022
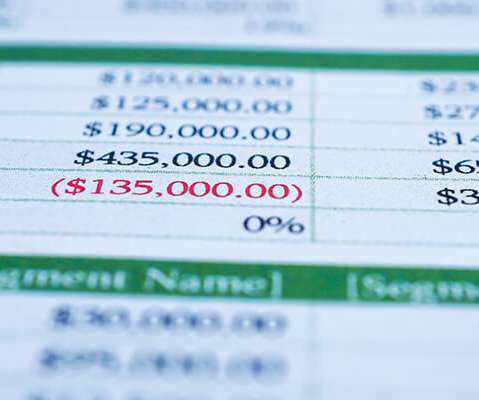
5) The Role Of Visuals In Accountant Reports. Accounting statements will let you keep track of business transactions, but they will also help you maintain a budget, predict cash flow, and forecast revenue. They also allow for an assessment of the current situation compared to a previous one and/or compared to a forecast.

Smart Data Collective
OCTOBER 13, 2021
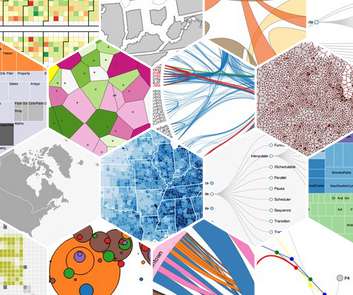
It can be used for something as visual as reducing traffic jams, to personalizing products and services, to improving the experience in multiplayer video games. We would like to talk about data visualization and its role in the big data movement. Data is useless without the opportunity to visualize what we are looking for.

Smart Data Collective
FEBRUARY 9, 2022
Learn how DirectX visualization can improve your study and assessment of different trading instruments for maximum productivity and profitability. Let’s dive right into how DirectX visualization can boost analytics and facilitate testing for you as an Algo-trader, quant fund manager, etc. But first, What is DirectX Anyway?

Expert insights. Personalized for you.


Let's personalize your content