This site uses cookies to improve your experience. To help us insure we adhere to various privacy regulations, please select your country/region of residence. If you do not select a country, we will assume you are from the United States. Select your Cookie Settings or view our Privacy Policy and Terms of Use.
Cookie Settings
Cookies and similar technologies are used on this website for proper function of the website, for tracking performance analytics and for marketing purposes. We and some of our third-party providers may use cookie data for various purposes. Please review the cookie settings below and choose your preference.
Used for the proper function of the website
Used for monitoring website traffic and interactions
Cookie Settings
Cookies and similar technologies are used on this website for proper function of the website, for tracking performance analytics and for marketing purposes. We and some of our third-party providers may use cookie data for various purposes. Please review the cookie settings below and choose your preference.
Strictly Necessary: Used for the proper function of the website
Performance/Analytics: Used for monitoring website traffic and interactions
Whether it’s controlling for common risk factors—bias in model development, missing or poorly conditioned data, the tendency of models to degrade in production—or instantiating formal processes to promote data governance, adopters will have their work cut out for them as they work to establish reliable AI production lines.
In todays data-driven world, tracking and analyzing changes over time has become essential. As organizations process vast amounts of data, maintaining an accurate historical record is crucial. History management in data systems is fundamental for compliance, business intelligence, dataquality, and time-based analysis.
Exclusive Bonus Content: Download Data Implementation Tips! Get our free checklist to build high-quality business dashboards! It helps managers and employees to keep track of the company’s KPIs and utilizes business intelligence to help companies make data-driven decisions. Digital age needs digital data.
1) What Is Data Interpretation? 2) How To Interpret Data? 3) Why Data Interpretation Is Important? 4) Data Analysis & Interpretation Problems. 5) Data Interpretation Techniques & Methods. 6) The Use of Dashboards For Data Interpretation. Business dashboards are the digital age tools for big data.
The Syntax, Semantics, and Pragmatics Gap in DataQuality Validate Testing Data Teams often have too many things on their ‘to-do’ list. They have a backlog full of new customer features or data requests, and they go to work every day knowing that they won’t and can’t meet customer expectations.
The Data Security and Governance category, at the annual Data Impact Awards, has never been so important. The sudden rise in remote working, a huge influx in data as the world turned digital, not to mention the never-ending list of regulations businesses need to remain compliant with (how many acronyms can you name in full?
Understanding the company’s true purpose unlocks the business model and sheds light on what is useful to do with the data. Since I work in the AI space, people sometimes have a preconceived notion that I’ll only talk about data and models. How did you obtain your training data? Source: Shane.
Especially popular in smart home IoT deployments. Typical use: smart home appliances like smart doorbells, smart thermostats, smart security camera, Amazon Echo, etc. A great thing about a mesh network is that when one device (one node) goes off, the rest can still function to send and receive data.
Big data has led to a number of changes in the digital marketing profession. The market for big data analytics in business services is expected to reach $274 billion by 2022. A large portion of this growth is attributed to the need for big data in the marketing field. Big data is becoming more important to modern SEO strategies.
This year’s Data Impact Awards were like none other that we’ve ever hosted. While everyone attended from the comfort of their own homes (and timezones), we were still able to celebrate the fantastic achievements of our customers. In fact, Experian admits to believing that data has the power to change lives.
A retail shop has just opened at Johannisplatz square 10 in Jena—home to Carl Zeiss. When Carl Zeiss produced his microscope prototype years earlier, he created a high standard for precision and quality, using the most advanced, efficient manufacturing processes of the time. And you know where to go. Digital Transformation
Predictive analytics definition Predictive analytics is a category of data analytics aimed at making predictions about future outcomes based on historical data and analytics techniques such as statistical modeling and machine learning. Predict the impact of new policies, laws, and regulations on businesses and markets.
Underlying digital transformation and investment decisions is a precious asset: data. Now more than ever, decision-makers are looking to do more with their data. This is because the majority of IT departments find it near impossible to just ‘ramp up’ data use, and even more difficult to do so at scale.
In particular, the company had to integrate billing data from SAP S/4HANA, an enterprise resource planning software designed specifically for large enterprises, with SAP Billing and Revenue Innovation Management (BRIM) and replicate the information to Google BigQuery, a fully managed, AI-ready data analytics platform.
As a technology company you can imagine how easy it is to think of data-first modernization as a technology challenge. Data fabric, data cleansing and tagging, data models, containers, inference at the edge – cloud-enabled platforms are all “go-to” conversation points. and “how to do it?” and “how to do it?”,
When you are done reading the post, you'll be super mad that your marketing strategy is not more influenced by your competitor's data! Since then, as luck would have it, we have more tools, they are smarter, and have richer data-sets. How is competitive intelligence data collected? CI data collection.
In particular, the company had to integrate billing data from SAP S/4HANA, an enterprise resource planning software designed specifically for large enterprises, with SAP Billing and Revenue Innovation Management (BRIM) and replicate the information to Google BigQuery, a fully managed, AI-ready data analytics platform.
With submissions for the Data Impact Awards coming in, we’re revisiting last year’s winners to find out what set them apart. . In 2020, Telkomsel took home the gold in the Industry Transformation category. . It’s end goal, to build a single digital platform to power data-driven decision-making. .
The stories and examples will hopefully help you intelligently approach your own data in these reports and quickly find insights you can action / share with your management team. Great landing pages equals more customers enticed to engage plus higher conversions plus higher (AdWords) quality score. Identify ones with high bounce rates.
BRIDGEi2i is pleased to announce its inclusion in Gartner’s Hype Cycle for CRM Sales Technology Report, 2021 in the knowledge graphs category. BRIDGEi2i is a trusted partner for enabling AI for Digital Enterprises by leveraging Data Engineering, Advanced Analytics, proprietary AI accelerators and Consulting expertise. About BRIDGE i2i.
It eliminates friction, enhances data analytics, and augments better resource utilization across organizations. AI is becoming the critical component of high-quality customer service. AI predictive analytics tools can analyze data more accurately. According to Gartner, AI augmentation will create $2.9 Personalized Content.
These models rely on learning algorithms that are developed and maintained by data scientists. Our collective understanding of realized AI and theoretical AI continues to shift, meaning AI categories and AI terminology may differ (and overlap) from one source to the next. The three kinds of AI based on capabilities 1.
With a properly designed interview process, teams can effectively and efficiently assess whether an applicant has the right set of data engineering skills without having to physically be in the same room. In some cases, they work to deploy data science models into production with an eye towards optimization, scalability and maintainability.
California Consumer Privacy Act (CCPA) compliance shares many of the same requirements in the European Unions’ General Data Protection Regulation (GDPR). Data governance , thankfully, provides a framework for compliance with either or both – in addition to other regulatory mandates your organization may be subject to.
Yet there are numerous business decisions that need to me made during the course of implementation, many of which have huge data implications. 8: Validate data is being captured correctly. # Our websites are there for customers and secondarily for us to collect data from. : ). 4: What’s your unique page definition? #
When it comes to data analysis, you are usually more likely to see me share guidance on advanced segmentation or custom reports or advanced social metrics or controlled experiments or economic value or competitive intelligence or web analytics maturity or one of an infinite number of difficult, if hugely rewarding, things. Ravaging data.
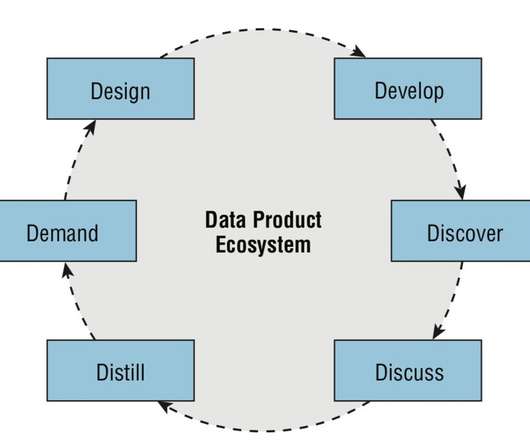
For data-driven thinking to flourish in your organization, you need to give people easy access to ‘data products’ that will answer their pressing questions. When we worked for a global manufacturer, a survey of information workers revealed that the top problem was an inability to find data products that served their needs.
Andrew Forsman is a Depict Data Studio student and self-described “data viz nerd” who has over 10 years of experience helping organizations plan for, execute, and learn from research and evaluations. They’re here this week sharing time-saving tips on using a voice command and dictation software called Dragon to help with data viz.
They expect (and often demand) easy and quick access to information and high-quality service. Finally, the connected car, connected home, and connected self are generating an enormous amount of data. Data — Too much and Too little. In order to get from here to there, insurance companies need to focus on data management.
I believe that it was erroneous not to answer the two questions above, it was erroneous to be tempted by the Big Numbers and not understand how Social Media channels actually worked (streams, home pages, personalization, rankings and more). For B2C companies, for some categories there might be value in having an organic presence.
As in, the former is in the business of providing data, the latter in the business of understanding the performance implied by the data. We send out our multi-tab spreadsheets, our best Google Analytics custom reports , our great dashboards full of data , and more to the tactical layer of data clients.
is expected to generate greater than $11 trillion in economic value as connected manufacturing processes, operations and their supply chains become more streamlined, efficient, agile and realize improved productivity, improved uptime and product quality. . Services are home grown and the skiing experience foundation is built on the basics.
This data you’ll see, the analysis you’ll do, will scare you. Below is a collection of nudges, curated from my global experiences, influenced by research and data I’ve access to. This shows hunger and desire to win… Their text: This image displays the quality of Kendrick's cabling that we use on all Premier and FireFly heaters.
A couple years ago, I was invited to be the keynote speaker for the Continuous Quality Improvement Conference in Illinois. Later, during the live keynote, I shared a few data visualization principles. Here’s one of my favorite submissions: This conference attendee worked at an organization that placed children into foster care homes.
Two other factors, in addition to its high-quality, personalized products, set MOD Pizza apart from the crowd. That works out to hundreds of MOD Squad events occurring every day such as hires, transfers, promotions, and separations, generating a lot of data. SAP solutions help MOD Pizza manage 400 event data changes daily.
In this blog, I will share how I built Pair , a scalable web application that takes in a product image, analyzes its design features using convolutional neural network, and recommends products in other categories with similar style elements. Both approaches analyze structured tabular data from the users or items.
In the previous blog , we discussed how Alation accelerates your journey to the Snowflake Data Cloud. In this blog, we will discuss how Alation provides a platform for data scientists and analysts to complete projects and analysis with speed. How will you support your key users in the Data Cloud?
by MICHAEL QUINN, JEREMY MILES, KA WONG As data scientists, we often encounter situations in which human judgment provides the ground truth. How do we think about the quality of human ratings, and how do we quantify our understanding is the subject of this post. Some of this data is human-labeled.
From the data presented, there is no way to tell if the Facebook campaign worked or not. The long flight home helped me arrive at two conclusions: We (CxOs, Marketers, Analysts) don't really understand what is unique about Facebook. Let's take off our clothes and jump into the cold unforgiving data waters and talk metrics.
The data in the browser is collected top-down from different sources and combined with data from the questionnaire completed by the vendors themselves. Depending on the data you provide, you will be visible in one, two or all three browser objects. What happens with my data? What does the website offer?
As Domino seeks to help data scientists accelerate their work, we reached out to AWP Pearson for permission to excerpt the chapter “Deep Reinforcement Learning” from the book, Deep Learning Illustrated: A Visual, Interactive Guide to Artificial Intelligence by Krohn, Beyleveld, and Bassens. GBpersec ]. Let’s return once more to Figure 13.1.
In this fluid situation, banks anticipate their risks to grow manifold under various categories: Banks will monitor portfolios at a much granular level and use agile methodology. Clients of banks will face stretched financial conditions, affecting their credit quality/ratings. Understanding & Managing Risks.
The answer, surprisingly, is that the crash was caused by a classic case of BAD DATA. That’s right–this spacecraft, this wonder of science, was rendered useless by bad data being entered into its flawless system. Collecting Survey Data at HOPE International So what exactly does this have to do with spreadsheets?
This was an eventful year in the world of data and analytics. billion merger of Cloudera and Hortonworks, the widely scrutinized GDPR (General Data Protection Regulation), or the Cambridge Analytica scandal that rocked Facebook. Amid the headline grabbing news, 2018 will also be remembered as the year of the data catalog.
We organize all of the trending information in your field so you don't have to. Join 42,000+ users and stay up to date on the latest articles your peers are reading.
You know about us, now we want to get to know you!
Let's personalize your content
Let's get even more personalized
We recognize your account from another site in our network, please click 'Send Email' below to continue with verifying your account and setting a password.


Let's personalize your content