This site uses cookies to improve your experience. To help us insure we adhere to various privacy regulations, please select your country/region of residence. If you do not select a country, we will assume you are from the United States. Select your Cookie Settings or view our Privacy Policy and Terms of Use.
Cookie Settings
Cookies and similar technologies are used on this website for proper function of the website, for tracking performance analytics and for marketing purposes. We and some of our third-party providers may use cookie data for various purposes. Please review the cookie settings below and choose your preference.
Used for the proper function of the website
Used for monitoring website traffic and interactions
Cookie Settings
Cookies and similar technologies are used on this website for proper function of the website, for tracking performance analytics and for marketing purposes. We and some of our third-party providers may use cookie data for various purposes. Please review the cookie settings below and choose your preference.
Strictly Necessary: Used for the proper function of the website
Performance/Analytics: Used for monitoring website traffic and interactions
Objective Understand what is Cross-sell using Vehicle insurance data. Learn how to build a model for cross-sell prediction. Introduction If you are a Machine learning enthusiast or a data science beginner, it’s important to have a guided journey and also exposure to a good set of projects.In
I am the Chief Practice Officer for Insurance, Healthcare, and Hi-Tech verticals at Fractal. The Insurance practice is currently engaged with several top 10 P&C insurers in the US, across the Insurance value chain through AI, Engineering, Design & Behavioural Sciences programs.
It might be in hundreds for a local grocery store, and it may be in millions for a national bank or an insurance company. This article was published as a part of the Data Science Blogathon Businesses and Companies have a lot of customers these days. The number of customers widely vary. Companies like Google and […].
This post is written in collaboration with Clarisa Tavolieri, Austin Rappeport and Samantha Gignac from Zurich Insurance Group. Zurich Insurance Group (Zurich) is a leading multi-line insurer providing property, casualty, and life insurance solutions globally.
The insurance company decided to migrate from on-premises BMC Remedy to cloud-based BMC Helix ITSM and Discovery. Collision detection identifies potential conflicts between proposed changes with a visual representation of changes scheduled at the same time, enabling IT teams to proactively manage and resolve potentially harmful conflicts.
Collecting big amounts of data is not the only thing to do; knowing how to process, analyze, and visualize the insights you gain from it is key. Your Chance: Want to visualize & track inventory KPIs with ease? Your Chance: Want to visualize & track inventory KPIs with ease? But let’s get back to our visual example.
Insurance companies provide risk management in the form of insurance contracts. Industry-specific, comprehensive, and reliable data management and presentation have become an issue of increasing concern in the insurance industry. The insurance dashboard is one of the most commonly used data display methods.
Some examples of such use cases, according to Evans, are answering questions on contracts or large documents, especially in the legal, insurance, and healthcare sectors.
Other document processing use cases include conducting clinical trials in life sciences, loan underwriting in retail banking, and insurance claims processing. AI-driven tools streamline workflows and reveal valuable insights, allowing organizations to manage contract reviews, risk analysis, and compliance with greater efficiency.
There’s a long history of language about moving data: we have had dataflow architectures, there's a great blog on visualization titled FlowingData , and Amazon Web Services has a service for moving data by the (literal) truckload. Data, even “big data,” doesn’t stay in the same place: it wants to move. Send a social worker?
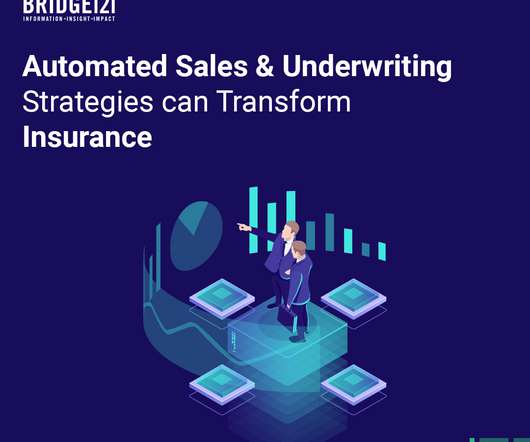
Automated Sales & Underwriting Strategies can Transform Insurance. One of the major repercussions of the COVID-19 pandemic in financial sectors has been the increase in awareness about insurable risks across categories and markets. Images 1: Challenges before insurance industry in the post-Corona world.
Linking purchase orders to bills of lading plus relevant insurance documents and insurance paperwork helps you file claims more quickly when something goes wrong. The post Order Management System Tweaks That Can Save Your Budget appeared first on BI Blog | Data Visualization & Analytics Blog | datapine.
It can be used to reveal structures in data — insurance firms might use cluster analysis to investigate why certain locations are associated with particular insurance claims, for instance. Generally, the output of data analytics are reports and visualizations. Data analytics and data science are closely related.
6 Ways AI Is Taking The Insurance Industry Into The Future. For example, the insurance industry is witnessing a strong acceleration in the adoption and growth of AI for task automation, improvement of service quality, and data-driven decision making. Insurance is a resource-intensive field. Claim Handling. Underwriting .
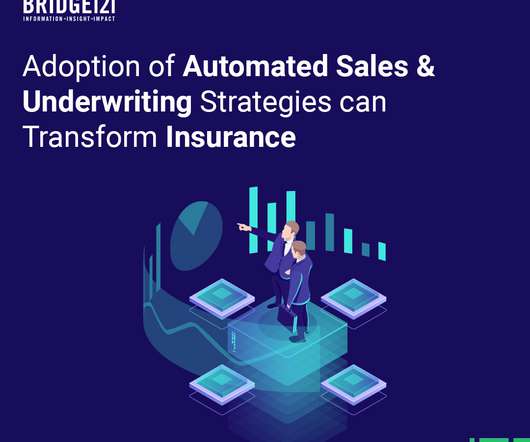
Adoption of Automated Sales & Underwriting Strategies can Transform Insurance. The insurance industry—which, in the US alone, stands at $1.2 trillion, is seeing the volume of insurance transactions growing every year. Images 1: Challenges before insurance in the post-Corona world. click here.
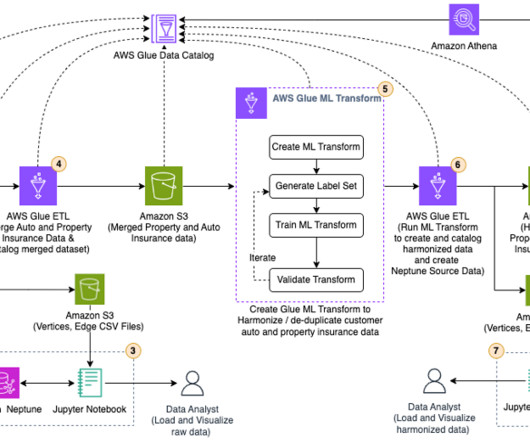
We use Amazon Neptune to visualize the customer data before and after the merge and harmonization. Overview of solution In this post, we go through the various steps to apply ML-based fuzzy matching to harmonize customer data across two different datasets for auto and property insurance.
For instance, a lot of IT leaders don’t know that data today has three streams — sciences, visualization, and engineering. IT leaders should also consider broadening their knowledge of the industry in which they work, says Mayank Bhargava, chief technology and data officer at Pramerica Life Insurance. Careers, Certifications, CIO
Your Chance: Want to visualize & track warehouse KPIs with ease? As seen in the image above, these costs can include employee salaries, taxes, insurance, storage, and even the investment opportunities that the business might be losing due to having a lot of resources tight to inventory.
Besides data mining, this tool is in-demand in the following fields: Market segmentation; Document clustering; Image segmentation; Pattern recognition; Insurance fraud detection and others. As a visualization tool – PCA is great at showing a bird’s view of the process. t-SNE – Non-linear Visualization Method.
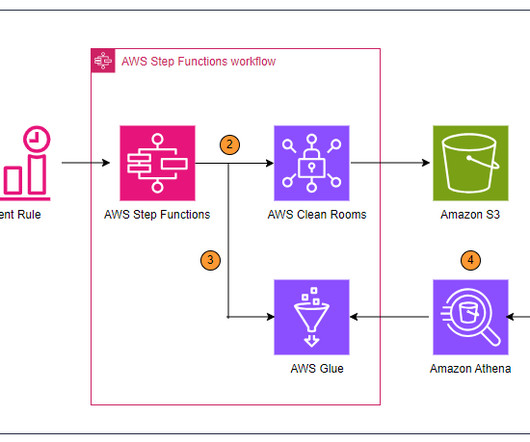
Then we can query the data with Amazon Athena visualize it in Amazon QuickSight. ticket_activity" where ticketactivity_id = 46 ; Visualize the data in QuickSight After you have the output file generated by the AWS Glue streaming job in the S3 bucket, you can use QuickSight to visualize the Hudi data files. Choose Visualize.
Regardless of your industry, whether it’s an enterprise insurance company, pharmaceuticals organization, or financial services provider, it could benefit you to gather your own data to predict future events. From a predictive analytics standpoint, you can be surer of its utility.
Its system, called the Transformation Acceleration Platform, is designed to capture all types of workflows, but Arrayworks maintains a particular focus on insurance automation. Its Connected Insurance system offers customized workflows to speed up all aspects of insurance. AuraQuantic.
While there are clear reasons SVB collapsed, which can be reviewed here , my purpose in this post isn’t to rehash the past but to present some of the regulatory and compliance challenges financial (and to some degree insurance) institutions face and how data plays a role in mitigating and managing risk. Well, sort of.
To keep processing costs low, many insurance carriers have a goal to increase the percentage of their claims that can be processed and decisioned with no human decision-making involved. Perhaps surprisingly, there remains a fair amount of human intervention involved in processing insurance claims. Focus on continuous improvement.
Here, I list some most basic visual elements you can use to build a dashboard. FineReport covers most of the data visualization components we will need every day. Insurance Dashboard. Insurance dashboard (made by FineReport). Only the most important indicators should be provided. Data visulization: draw your canvas.
As a core principle of data management, all BI & Analytics teams engage with data lineage at some point to be able to visualize and understand how the data they process moves around throughout the various systems that make up their data environment. They then relayed that information to insurance companies.
Data visualization methods, such as graphs and charts, reveal trends and insights in an instant. Improved Insurance Claim Processing. That’s a great challenger for insurance agencies. But things have changed, and seamless software dashboards give critical team members real-time access to the most recent data.
80% of data and analytics leaders with global life insurance and property & casualty carriers surveyed by McKinsey reported that their analytics investments are not delivering high impact. Begin with an agile analytic deployment platform, not with visualization. What’s stopping them from delivering high impact?
Significantly, for insurance companies, holistic healthcare can help to provide a comprehensive view of a patient’s health history and tailored packages that can be specific to the needs of each individual. Wearables could even potentially be used to collect and provide key health data among patients over the coming years.
Machine learning is used in almost every industry, notably finance , insurance , healthcare , and marketing. H2O is widely used in risk and fraud trend analysis, insurance customer analysis, patient analysis in healthcare, advertising costs and ROI, and customer intelligence.
“It democratizes the architecture so you can ask questions about the applications used,” says enterprise architect Mike Winfield of London-based Tokio Marine Kiln, a specialist insurance company. But in reality, this isn’t always necessary, and the CIO and organization inherit another legacy platform that becomes difficult to exit.
You’ll learn how to implement a transformative solution that empowers your organization with near-real-time data indexing and visualization capabilities. Solution overview The architecture diagram of FIS’s near-real-time data indexing and visualization solution incorporates various AWS services for specific functions.
Here are some financial analytics tools that are worth exploring: TrendingView is a financial analytics tool that helps you create useful financial visualizations. The right data analytics tools can be very valuable. FactSet Research Management is a financial analytics tool that helps companies take advantage of opportunities more quickly.
Business Intelligence describes the process of using modern data warehouse technology, data analysis and processing technology, data mining, and data display technology for visualizing, analyzing data, and delivering insightful information. Insurance Dashboard (by FineReport). BI dashboard (by FineReport). Free Download.
But to build that dashboard, someone has to assemble all the components, the key performance indicators (KPIs), the data visualizations, and all of the dashboard’s data feeds. The BI system can discover business-critical relationships in the data and automatically build visualizations and dashboards.
Solution overview In this, we will provide a step-by-step guide showing you how you can build a real-time OLAP datastore on Amazon Web Services (AWS) using Apache Pinot on Amazon Elastic Compute Cloud (Amazon EC2) and do near real-time visualization using Tableau. You can use Amazon Managed Service for Apache Flink service.
Instead, they rely on up-to-date dashboards that help them visualize data insights to make informed decisions quickly. QuickSight is used to query, build visualizations, and publish dashboards using the data from the query results. Choose Visualize. On the Analysis tab, choose the visual type of your choice and add visuals.
Insurance company Aflac is one company making sure this is the case to maintain human oversight over the AI, instead of letting it act completely autonomously. In some cases, particularly for rapid prototyping or when working with less technical stakeholders, we employ visual development tools,” says Avancini.
Privately it will come from hospitals, labs, pharmaceutical companies, doctors and private health insurers. Data mapping management to capture the data flows, reconstruct data pipelines, and visualize data lineage. These numerous data types and data sources most definitely weren’t designed to work together.
Organizations of all sizes and stages can use BI software to analyze, manage, and visualize business data. Based on business data, BI visualizes business problems through graphics and models. Insurance Dashboard(by FineReport). The Use of BI in the Enterprise. Here are a few ways and samples of enterprise BI applications.
Flockey provides his team with a dashboard for real-time visualization of crowd movement and risks. Ensuring safeguards also has a positive impact on employee productivity and mental health as well as venue operations by helping to lower infection rates and, subsequently, insurance costs. So, how does it work?
3) That’s where our data visualization and user experience capabilities helped them turn this data into a web-based analytical tool that focused users on the metrics and peer groups they cared about. There are many paths to consider: Visual representations that reveal patterns in the data and make it more human readable. Just kidding!
TAI Solutions provides IT services and solutions to major players in the financial services industry, particularly in the banking and insurance sectors. The organization designs, develops, and manages IT processes, infrastructures, and applications tailored for banks and insurance companies to build and enhance their digital capabilities.
Real time business intelligence is the use of analytics and other data processing tools to give companies access to the most recent, relevant data and visualizations. To provide real-time data, these platforms use smart data storage solutions such as Redshift data warehouses , visualizations, and ad hoc analytics tools.
We organize all of the trending information in your field so you don't have to. Join 42,000+ users and stay up to date on the latest articles your peers are reading.
You know about us, now we want to get to know you!
Let's personalize your content
Let's get even more personalized
We recognize your account from another site in our network, please click 'Send Email' below to continue with verifying your account and setting a password.


Let's personalize your content