This site uses cookies to improve your experience. To help us insure we adhere to various privacy regulations, please select your country/region of residence. If you do not select a country, we will assume you are from the United States. Select your Cookie Settings or view our Privacy Policy and Terms of Use.
Cookie Settings
Cookies and similar technologies are used on this website for proper function of the website, for tracking performance analytics and for marketing purposes. We and some of our third-party providers may use cookie data for various purposes. Please review the cookie settings below and choose your preference.
Used for the proper function of the website
Used for monitoring website traffic and interactions
Cookie Settings
Cookies and similar technologies are used on this website for proper function of the website, for tracking performance analytics and for marketing purposes. We and some of our third-party providers may use cookie data for various purposes. Please review the cookie settings below and choose your preference.
Strictly Necessary: Used for the proper function of the website
Performance/Analytics: Used for monitoring website traffic and interactions
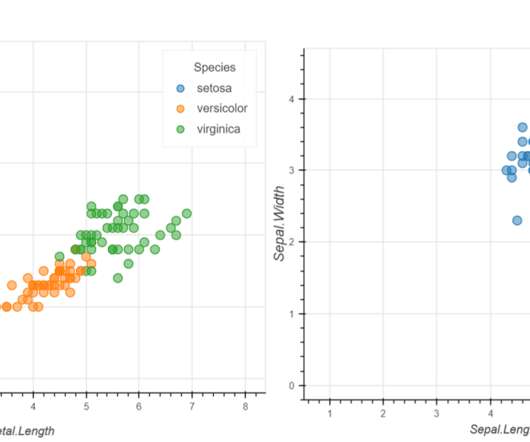
The post Interactive Data Visualization using rbokeh appeared first on Analytics Vidhya. Introduction Data Visualization is used to present the insights in a given dataset. With meaningful and eye-catching charts, it becomes easier to communicate data analysis findings.
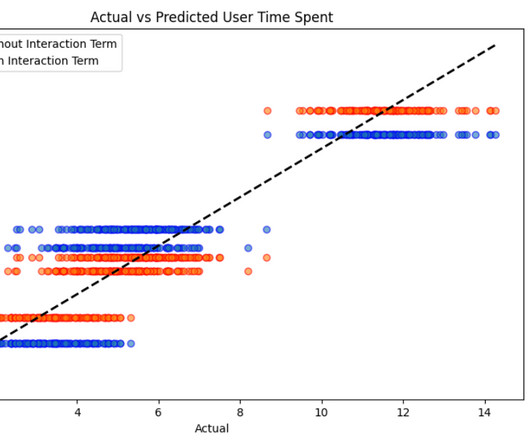
Introduction Interaction terms are incorporated in regression modelling to capture the effect of two or more independent variables in the dependent variable. These are also […] The post A Guide to Understanding Interaction Terms appeared first on Analytics Vidhya.
This enhancement aims to streamline personalized interactions and improve the overall experience of using ChatGPT. OpenAI has added a new ‘Memory’ feature for ChatGPT Plus subscribers. It allows the AI-powered chatbot to remember and utilize personalized information shared during conversations.
The post How to Create Stunning and Interactive Dashboards in Excel? This article was published as a part of the Data Science Blogathon Introduction I have been using Pandas with Python and Plotly to create some of the most stunning dashboards for my projects. I […]. appeared first on Analytics Vidhya.
Speaker: Dan Jenkins - Human Factors & Research Lead – DCA Design International
It is a philosophy that encourages us to consider how size, shape, age, gender, sexuality, ethnicity, education levels, income, spoken languages, culture and customs, and even diets shape the way we interact with the world. Inclusive design is about designing for as diverse a range of people as possible.
With the growing importance of data science and machine learning, data analysis holds a special place in […] The post Creating Interactive and Animated Charts with ipyvizzu appeared first on Analytics Vidhya. Introduction Data visualization (DV) plays a crucial role in analyzing and interpreting data.
It’s like having […] The post Poe’s Multi-Bot Chat: A Game-Changer in AI Interactivity appeared first on Analytics Vidhya. Poe lets you chat with different AI models all in one place. This means you can get a variety of viewpoints on any topic, making your conversations richer and more helpful.
Google’s latest endeavor, Gemini, is poised to redefine user interaction in the digital landscape. Let’s explore the features of Google’s […] The post Google Gemini Ultra: Redefining User Interaction with Advanced AI appeared first on Analytics Vidhya. This innovative AI project introduces Gemini Ultra 1.0,
The post Create an Interactive Sales Dashboard from Scratch on Microsoft Excel appeared first on Analytics Vidhya. But unfortunately, the majority of people use MS Excel only to insert data and perform basic arithmetic operations, without knowing its true potential. So my dear audience, let us […].
Think your customers will pay more for data visualizations in your application? Five years ago they may have. But today, dashboards and visualizations have become table stakes. Discover which features will differentiate your application and maximize the ROI of your embedded analytics. Brought to you by Logi Analytics.
The dataset aims to optimize language model performance by addressing numerous […] The post Revolutionizing Virtual Assistant Interactions: PRESTO Dataset Tackles Multilingual NLU Challenges appeared first on Analytics Vidhya. This dataset consists of more than 550,000 multilingual conversations between humans and virtual assistants.
This improvement streamlines the ability to access and manage your Airflow environments and their integration with external systems, and allows you to interact with your workflows programmatically. Airflow REST API The Airflow REST API is a programmatic interface that allows you to interact with Airflow’s core functionalities.
OpenAI has taken a significant step in enhancing user control over its AI language model, ChatGPT, by introducing a new feature called ‘custom instructions’ This latest update aims to streamline interactions and provide a more personalized experience for users.
This distinction is critical because the challenges and solutions for conversational AI are unique to systems that operate in an interactive, real-time environment. But it harbors serious issues that become apparent at scale: Unreliability Every interaction becomes a new opportunity for error. Its quick to implement and demos well.
Generative AI is upending the way product developers & end-users alike are interacting with data. Despite the potential of AI, many are left with questions about the future of product development: How will AI impact my business and contribute to its success?
Picture a world where your interactions with Large Language Models(LLMs) are efficient, profoundly intuitive, and impactful. Introduction Imagine having the full potential of your favorite AI assistant, transforming it from a helpful tool into a creative powerhouse. appeared first on Analytics Vidhya.
It aims to streamline the coordination of AI agents through scalable and user-friendly mechanisms, making it easier to manage interactions within complex workflows. OpenAI Swarm – launched in 2024, is an experimental framework designed to simplify the orchestration of multi-agent systems for developers.
Systems of influence At the most immediate level is the microsystem the developers, engineers, and users directly interacting with AI. Artificial intelligence (AI) is no longer the stuff of science fiction; its here, influencing everything from healthcare to hiring practices. This analogy might seem odd, but its instructive.
Your platform needs to be opened up so the LLM can reason and interact with the platform in an easy way, he says. All of this creates new challenges, on top of those already posed by the gen AI itself. Plus, unlike traditional automations, agentic systems are non-deterministic. But it doesnt help when a legacy system operates in batch mode.
Speaker: Anthony Roach, Director of Product Management at Tableau Software, and Jeremiah Morrow, Partner Solution Marketing Director at Dremio
As a result, these two solutions come together to deliver: Lightning-fast BI and interactive analytics directly on data wherever it is stored. As a result of a strategic partnership, Tableau and Dremio have built a native integration that goes well beyond a traditional connector. A seamless and efficient customer experience.
Its in beta testing, but its already shaking up how AI can interact with software. Imagine your AI assistant taking over your mouse and keyboard to navigate a computer just like you wouldclicking, typing, and scrolling, all by “looking” at the screen.
It might be for low-margin customer interactions, but for times when millions of dollars are on the line, the cost of invoking generative AI is a pittance, Gualtieri says. “If When the research analysts want the research, that’s when the AI gets activated. Google has come up with a RAG service. SAIC offers it to SAIC customers as well.
Is some tool coming, or is this just a playful nod to how we interact with code today? Introduction After Andrej Karpathy’s viral tweet, “English has become the new programming language, ” here is another trending tweet on X saying, “ Future be like Tab Tab Tab.” appeared first on Analytics Vidhya.
When combined with LlamaIndex, it becomes a powerful tool for visualizing and interacting with knowledge graphs in real time. yFiles is a powerful SDK designed to simplify the visualization of complex networks and data relationships.
Speaker: Dean Yao, Sr. Director of Product Marketing, Logi Analytics
World-class software teams are embedding operational reports to empower end users with interactive data visualizations, detailed information, and highly precise formats that can be shared via email, PDF, print, or online.
Reed McGinley-Sempel, CEO of identity platform Stytch, for instance, notes that the agent experience is emerging as a key priority for enterprises, while in the past it was the UX (user experience) and DX (developer experience) that determined how humans and developers interacted with software.
You may be unfamiliar with the name, but Norma Group products are used wherever pipes are connected and liquids are conveyed, from water supply and irrigation systems in vehicles, trains and aircraft, to agricultural machinery and buildings. It all starts with a sense of presence, both remote and local.
AI agents are autonomous intelligent systems that can interact with their environment, make decisions, and take action […] The post The Effect of AI Agents in the Job Market in 2025 appeared first on Analytics Vidhya. Artificial intelligence (AI) is rapidly changing the world as we know it, and the job market is no exception.
Microsoft‘s business analytics product, Power BI, delivers interactive data visualization BI capabilities that allow users to see and share data and insights throughout their organisation. Power BI provides insight data by using data interactively and exploring it by visualizations. […]. What is Power BI?
Speaker: Nicholas Zeisler, CX Strategist & Fractional CXO
The first step in a successful Customer Experience endeavor (or for that matter, any business proposition) is to find out what’s wrong. If you can’t identify it, you can’t fix it! 💡 That’s where the Voice of the Customer (VoC) comes in. So how do you reach a place where VoC actually provides clarity?
OpenAI, a leading AI company, offers API keys for developers to interact with its platform and utilize its LLM models in various projects. In this article, you’ll learn how to create your own OpenAI API Key, updated as of 2024.
to offer context-aware interactions that boost productivity and engagement. The integration of Meta AI into WhatsApp is transforming our mobile experience. Meta has launched its virtual assistant across its various platforms: Facebook, Instagram, WhatsApp, and Messenger.
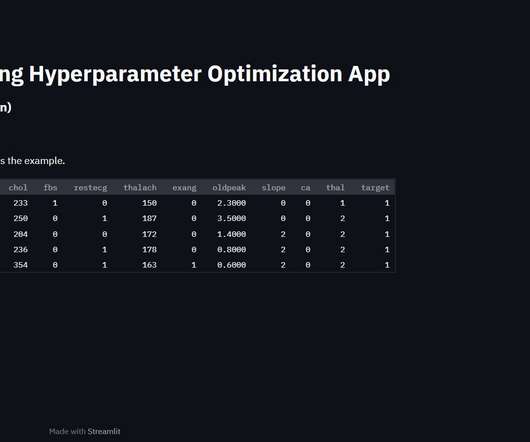
This article was published as a part of the Data Science Blogathon About Streamlit Streamlit is an open-source Python library that assists developers in creating interactive graphical user interfaces for their systems. Using Streamlit, we can quickly create interactive web apps and deploy them. Frontend […].
When it is combined with Jupyter Notebook, it offers interactive experimentation, documentation of code and data. Keyboard shortcuts, magic commands, interactive widgets, and visualization tools can streamline workflow […] The post Best Python Tricks in Jupyter Notebook appeared first on Analytics Vidhya.
Uncover how an interactive web application can be built on top of your model. Not being able to envision various organizational scenarios means you won't be able to navigate them, leaving you dead in the water. Experience how efficient you can be when you fit your model with actionable data. Don't let uncertainty drive your business.
Google has introduced the Google Gen AI Toolbox for Databases, an open-source Python library designed to simplify database interaction with GenAI. As part of its public […] The post Google Gen AI Toolbox: A Python Library for SQL Databases appeared first on Analytics Vidhya.
Chatbots have transformed how we interact with technology, offering automated, intelligent conversations. However, building scalable and flexible systems can be challenging. AutoGen simplifies this process with its Programming and Low-code frameworks. Last week we learned how to build agentic chatbots using AutoGen’s Programming framework.
It is impossible to go through each feature and all the interactions one by one which may take days or even weeks. Enter Selenium, the game changing tool which automates web browser interaction and thus is more efficient when […] The post A Comprehensive Guide to Selenium with Python appeared first on Analytics Vidhya.
In our cutthroat digital age, the importance of setting the right data analysis questions can define the overall success of a business. That being said, it seems like we’re in the midst of a data analysis crisis. That being said, it seems like we’re in the midst of a data analysis crisis. Data Is Only As Good As The Questions You Ask.
In today’s ambitious business environment, customers want access to an application’s data with the ability to interact with the data in a way that allows them to derive business value. After all, customers rely on your application to help them understand the data that it holds, especially in our increasingly data-savvy world.
Embarking on a journey of innovation, the AR Interactive Vehicle Display promises to redefine the way we experience sightseeing. This revolutionary technology seamlessly integrates augmented reality (AR) with travel, enriching the scenic adventure for passengers.
A collaborative and interactive workspace allows users to perform big data processing and machine learning tasks easily. Introduction Azure Databricks is a fast, easy, and collaborative Apache Spark-based analytics platform that is built on top of the Microsoft Azure cloud.
It has gained significant traction in recent years due to its applications in diverse fields such as psychology, human-computer interaction, and marketing. Introduction Emotion detection is the most important component of affective computing.
They simplify and compress complex queries, making database interactions more efficient and manageable. Introduction Structured Query Language (SQL) is the foundation of managing and manipulating relational databases. One of the most powerful features in SQL is the use of views. appeared first on Analytics Vidhya.
Download this guide and receive: An interactive flowchart to assess where you are in your omnichannel journey. Many organizations are striving for omnichannel, but it can be a daunting journey—unless you have a map.
We organize all of the trending information in your field so you don't have to. Join 42,000+ users and stay up to date on the latest articles your peers are reading.
You know about us, now we want to get to know you!
Let's personalize your content
Let's get even more personalized
We recognize your account from another site in our network, please click 'Send Email' below to continue with verifying your account and setting a password.


Let's personalize your content