This site uses cookies to improve your experience. To help us insure we adhere to various privacy regulations, please select your country/region of residence. If you do not select a country, we will assume you are from the United States. Select your Cookie Settings or view our Privacy Policy and Terms of Use.
Cookie Settings
Cookies and similar technologies are used on this website for proper function of the website, for tracking performance analytics and for marketing purposes. We and some of our third-party providers may use cookie data for various purposes. Please review the cookie settings below and choose your preference.
Used for the proper function of the website
Used for monitoring website traffic and interactions
Cookie Settings
Cookies and similar technologies are used on this website for proper function of the website, for tracking performance analytics and for marketing purposes. We and some of our third-party providers may use cookie data for various purposes. Please review the cookie settings below and choose your preference.
Strictly Necessary: Used for the proper function of the website
Performance/Analytics: Used for monitoring website traffic and interactions
What gets measured gets done.” – Peter Drucker. In other words, by analyzing KPI examples for a specific industry or function, a business can reduce the amount of time needed to evaluate the overall performance. By setting operational performance measures, you will know what is happening at every stage of your business.
One of the most effective means of doing this is by utilizing KPI reporting tools. Exclusive Bonus Content: Understanding KPIs & reports – A summary! Let’s start by considering what KPIs are and what they mean in a business context. What Is A KPI? What Is A KPI Report? Why Are KPI Reports Important?
While there are numerous KPI examples you can choose from, you should pick only the most important ones and focus on the right ones for your business. That said, using the right KPIs is essential to both your immediate and long-term business activities. But first, let’s ask ourselves the question, ‘ What is KPI tracking?’.
This is where interactive weekly reports come into the picture. Powered by interactive visualizations, managers use these reports to outline the progress of the week and find improvement opportunities for the future. We will see these interactive reports in action throughout the post. What Is A Weekly Report?
Data dashboards provide a centralized, interactive means of monitoring, measuring, analyzing, and extracting a wealth of business insights from relevant datasets in several key areas while displaying aggregated information in a way that is both intuitive and visual. They Are Interactive. What Is A Data Dashboard?
In this post, we will cover essential supply chain KPIs and deliver bits and details about the top 15 that you should track. Finally, we will show how to combine those metrics with the help of modern KPI software and create professional supply chain dashboards. But first, let’s start with the basic definition. Inventory Turnover.
In a hyper-connected digital world driven by data, there has never been a better time for businesses to gather meaningful insights on their target prospects, in addition to measuring ongoing levels of commercial growth and performance. What Are Social Media KPIs? Engagement: How many people are interacting with your content.
1) What Are KPIs? 3) KPIs vs Metrics: Main Differences. 4) Tips For KPI & Metrics Tracking. This is done with the help of KPI and metrics. KPIs and metrics are often considered the same thing in day-to-day business contexts. Let’s quick it off with the definition of metrics and KPIs! What Are KPIs?
Table of Contents 1) What Is A Warehouse KPI? 2) Why Do You Need Warehouse KPIs? 3) Top 15 Warehouse KPIs Examples 4) Warehouse KPI Dashboard Template The use of big data and analytics technologies has become increasingly popular across industries. What Is A Warehouse KPI? Let’s dive in with the definition.
An effective modern means of extracting real value from your research results such as brand analysis, market research reports present and arrange data in a way that is digestible and logical in equal measures through professional online reporting software and tools. Primary KPIs: a) Unaided Brand Awareness. b) Aided Brand Awareness.
In correlation with the planning processes, defining your endgame and setting the right KPIs will create success. While there are numerous KPI examples you can choose from, only a few of them will help you answer specific business questions. Implement your BI solution and measure success. Define goals and objectives.
There are also different types of sales reports that will focus on different aspects: the sales performance in general, detailing the revenue generated, the sales volume evolution, measuring it against the sales target pre-set, the customer lifetime value, etc. So, we’re going to keep track of them on a frequent basis.”.
To compete, evolve, and remain relevant, today’s forward-thinking businesses always strive to improve the efficiency of their internal processes while measuring their success – and hiring talent is no exception. .” – Bill Gates. According to ManpowerGroup, around 72.8% That’s where recruitment metrics come in. And why should you care?
A data-driven finance report is also an effective means of remaining updated with any significant progress or changes in the status of your finances, and help you measure your financial results, cash flow, and financial position. b) Measure Revenue Loss. Metrics used to measure these factors can include: Number of daily transactions.
Managerial reports use a lot of the same data as financial reports, but presented in a more useful way, for example via interactive management dashboards. For example, a junior sales manager and a junior marketing manager are both going to want to see different KPIs. Who are my most profitable clients?
By utilizing interactive digital dashboards, it’s possible to leverage data to transform metrics into actionable insights to spot weaknesses, identify strengths, and predict events before they occur. This information proved invaluable in offering tailored therapy while taking all-important measures to reduce suicide rates.
A call center dashboard is an intuitive visual reporting tool that displays a range of relevant call center metrics and KPIs that allow customer service managers and teams to monitor and optimize performance and spot emerging trends in a central location. Put simply, customer service is the beating heart of your entire operation.
The rise of innovative, interactive, data-driven dashboard tools has made creating effective dashboards – like the one featured above – swift, simple, and accessible to today’s forward-thinking businesses. The interactive nature of data dashboards means that you can let go of PowerPoint-style presentations from the 90s.
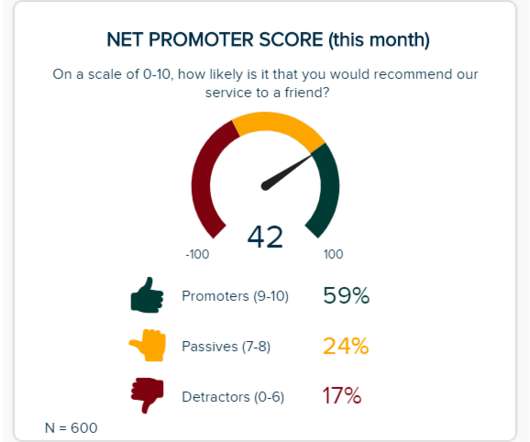
With a shape that resembles a speedometer, this chart aims to track the progress of a KPI in comparison to a set target or to other time periods. Using them in this context will help you understand the performance of a specific KPI based on a target you pre-defined.
Management thinker Peter Drucker once stated, “if you can’t measure it, you can’t improve it” – and he couldn’t be more right. Usually, reports are done on an annual, monthly, weekly or daily basis, but sometimes you need to create an ad-hoc, KPI report for a particular purpose. 2) Marketing KPI Report. 1) Marketing CMO report.
A CEO dashboard is an interactive platform that visualizes data to empower business leaders to track, measure, analyze, and monitor business performance in a number of areas, enabling them to make data-driven decisions and see the big business picture. KPIs used: Sales Target & Growth. KPIs used: Revenue per Sales Rep.
By integrating these key performance indicators (KPIs) and goals into their dashboards, companies can proactively identify issues, minimize costs and strive to exceed performance expectations. Of course, it is also important to choose the right KPI. Encourages interactivity and analysis. Provide insight into customer behavior.
Here we explore the meaning and value of incremental sales in the world of business, as well as the additional KPI examples and metrics you should track to ensure ongoing success. Incremental sales is a KPI used by marketers to assess the financial value of various promotional activities. What Are Incremental Sales?
Agree companywide what KPIs are most relevant for your business and how do they already develop. Research different KPI examples and compare to your own. Once you have your data analytics questions, you need to have some standard KPIs that you can use to measure them. All of these KPI examples can be valid choices.
First, you figure out what you want to improve; then you create an experiment; then you run the experiment; then you measure the results and decide what to do. That metric is tied to a KPI. It's the target for your KPI. We’re making an educated guess about what could improve the KPI based on what we learned in step 1.
By using the right data storytelling tools to measure, track, and extract relevant data and place it into a visual format that fits into a narrative based on specific business goals, you will make your analytical information accessible to a wider audience. Compliance Rate KPI.
We will discuss report examples and templates you can use to create your own report, use its features in an interactive way, and discover relevant inputs for your specific industry. In the process, we will use an online data visualization software that lets us interact with, and drill deeper into bits and pieces of relevant data.
That said, measuring the success of your those efforts is another great part of the job, and on many occasions, it can prove to be overwhelming as you need to use multiple tools to gather the data. This is no longer the case, thanks to the introduction of modern reporting tools such as interactive dashboards. Let’s get started!
In this article, we will go deeper into the definition of product KPIs: what they are, who needs them, and why; then, we will go over the steps to find the best product success metrics; and finally, we will provide some useful examples. By using interactiveKPIs, product managers can optimize product strategies to ensure business growth.
It is time to save valuable staff resources and walk away from static spreadsheets by using interactive dashboards. Although there are various KPI examples , you should choose only the best fit for your department or industry. 4) Businesses aren’t measuring the right indicators. There may be push back.
Operational reporting is an effective, results-driven means of tracking, measuring and analyzing a business’s regular deliverables and metrics, usually on a daily, weekly, and sometimes monthly basis with the help of modern and professional BI reporting tools. Primary KPIs: On-Time Shipping. Primary KPIs: Revenue per Sales Rep.
8) Revenue And Sales Interactive Management Overview. This is a really fun interactive sales graph, as it lets you see your revenue and sales according to different time periods that you select. A revenue graph that is worth exploring on a monthly basis by utilizing a modern KPI reporting software. 11) Sales KPI Dashboard.
Thanks to the right KPI software , it is much easier to identify trends and setting goals that will ultimately increase productivity, drive growth, and boost profits. With the help of a dashboard designer , you can simply drag-and-drop your values and create interactive visualizations that will point out errors immediately.
The additional features provide access from mobile phones, tablets, and laptops so you can access your information and selected SaaS KPIs anytime, any place. Compiling analysis results with the help of interactive dashboards and charts is one of the main features SaaS solution can offer. A SaaS KPI dashboard will help you do just that.
That’s why using a modern dashboard tool is vital for monitoring and analyzing multiple touchpoints and presenting data in real-time, visually, and with strong interactivity levels so any operational activity can’t be left unnoticed. That said, in essence, we will discuss: What is a COO dashboard? What is a COO report?
But with dynamic, interactive dashboard reporting software , your structure will be far simpler and more holistic. A modern data report offers a host of interactive data charts and visualizations you can use to your advantage.
That is all possible thanks to the interactive nature of dashboards. Small business metrics are performance measurements that provide insights into the progress of different activities and company goals. To get you started on the topic, you can take a look at our post on KPIs vs metrics. Marketing KPI dashboard.
Our Salesforce report templates are centralized, interactive, easy to use, and serve up KPI-driven insights that empower business to gain an all-important edge on the competition. A KPI software will help you track, measure, and analyze specific pockets of data. . 4) Track, measure, refine, repeat.
To provide the best possible standards of CS on a consistent basis, understanding how your consumers interact with your business is vital. To get details into each mentioned KPI, you can read more about it below in our examples section of the article. What Are The Benefits Of Customer Service Reports? That brings us to our next point.
Not only your business will have the opportunity to explore, monitor and access real-time data, but the interactivity levels are an invaluable resource for managing enormous amounts of data, especially in the financial sector where a small mistake can lead to millions of damages. That said, in a time wherein less than two years, around 1.7
Forrester Research defines the ‘customer experience’ as: “How customers perceive their interactions with your company.”. Moreover, measuring these metrics will also avert potential customer frustrations, monitor customer satisfaction levels, and give you a more concrete, informed idea of how your customer-facing team is doing.
KPI dashboard releases you from your worries and troubles. What is a KPI dashboard? Definition of KPI dashboard. KPIs (Key performance indicators) are quantitative indicators used to measure the work performance of staff, being the foundation of an enterprise performance management system.
Since humans process visual information 60.000 times faster than text , the workflow can be significantly increased by utilizing smart intelligence in the form of interactive, and real-time visual data. Today there are numerous ways in which a customer can interact with a specific company. Source: newgenapps.com *.
That’s where KPI tracking comes into play. In this article, we will explore the concept of KPI tracking, its definition, its importance for businesses, and how to perform KPI tracking. Additionally, we will provide real-life examples of KPI tracking dashboards and a step-by-step guide to setting up your own dashboard.
We organize all of the trending information in your field so you don't have to. Join 42,000+ users and stay up to date on the latest articles your peers are reading.
You know about us, now we want to get to know you!
Let's personalize your content
Let's get even more personalized
We recognize your account from another site in our network, please click 'Send Email' below to continue with verifying your account and setting a password.
Let's personalize your content