This site uses cookies to improve your experience. To help us insure we adhere to various privacy regulations, please select your country/region of residence. If you do not select a country, we will assume you are from the United States. Select your Cookie Settings or view our Privacy Policy and Terms of Use.
Cookie Settings
Cookies and similar technologies are used on this website for proper function of the website, for tracking performance analytics and for marketing purposes. We and some of our third-party providers may use cookie data for various purposes. Please review the cookie settings below and choose your preference.
Used for the proper function of the website
Used for monitoring website traffic and interactions
Cookie Settings
Cookies and similar technologies are used on this website for proper function of the website, for tracking performance analytics and for marketing purposes. We and some of our third-party providers may use cookie data for various purposes. Please review the cookie settings below and choose your preference.
Strictly Necessary: Used for the proper function of the website
Performance/Analytics: Used for monitoring website traffic and interactions
Metadata has been defined as the who, what, where, when, why, and how of data. Without the context given by metadata, data is just a bunch of numbers and letters. But going on a rampage to define, categorize, and otherwise metadata-ize your data doesn’t necessarily give you the key to the value in your data. Hold on tight!
Will content creators and publishers on the open web ever be directly credited and fairly compensated for their works’ contributions to AI platforms? At the same time, Miso went about an in-depth chunking and metadata-mapping of every book in the O’Reilly catalog to generate enriched vector snippet embeddings of each work.
In their wisdom, the editors of the book decided that I wrote “too much” So, they correctly shortened my contribution by about half in the final published version of my Foreword for the book. I publish this in its original form in order to capture the essence of my point of view on the power of graph analytics.
The CDH is used to create, discover, and consume data products through a central metadata catalog, while enforcing permission policies and tightly integrating data engineering, analytics, and machine learning services to streamline the user journey from data to insight. The architecture is shown in the following figure.
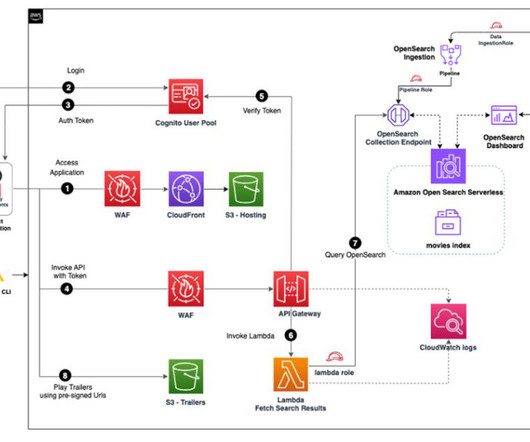
Solution overview AWS AppSync creates serverless GraphQL and pub/sub APIs that simplify application development through a single endpoint to securely query, update, or publish data. When you’re logged in, you can start interacting with the application. Make sure the function is already deployed and working in your account.
We have enhanced data sharing performance with improved metadata handling, resulting in data sharing first query execution that is up to four times faster when the data sharing producers data is being updated. You can also create new data lake tables using Redshift Managed Storage (RMS) as a native storage option.
This post describes the process of using the business data catalog resource of Amazon DataZone to publish data assets so theyre discoverable by other accounts. Data publishers : Users in producer AWS accounts. Create the necessary publish project for AWS Glue and Amazon Redshift in the producer account.
We introduce you to Amazon Managed Service for Apache Flink Studio and get started querying streaming data interactively using Amazon Kinesis Data Streams. Datasets used for generating insights are curated using materialized views inside the database and published for business intelligence (BI) reporting.
It focuses on the key aspect of the solution, which was enabling data providers to automatically publish data assets to Amazon DataZone, which served as the central data mesh for enhanced data discoverability. Data domain producers publish data assets using datasource run to Amazon DataZone in the Central Governance account.
They prefer self-service development, interactive dashboards, and self-service data exploration. Metadata management. Users can centrally manage metadata, including searching, extracting, processing, storing, sharing metadata, and publishingmetadata externally. Interactive visual exploration.
Generally, software providers publish a beta version of a feature for enterprises to try and weed out bugs before making it generally available to any willing enterprise customer. While rebranding the Studio platform, Salesforce has also rebranded its Skills Builder feature to Copilot Builder, which is in beta or public preview.
Data and Metadata: Data inputs and data outputs produced based on the application logic. Also included, business and technical metadata, related to both data inputs / data outputs, that enable data discovery and achieving cross-organizational consensus on the definitions of data assets. Key Design Principles of a Data Mesh.
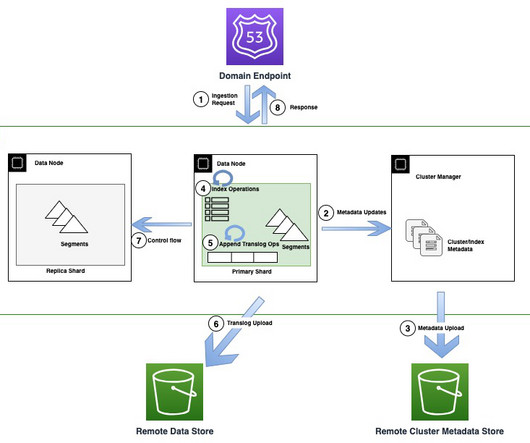
Today, customers widely use OpenSearch Service for operational analytics because of its ability to ingest high volumes of data while also providing rich and interactive analytics. When the transfer is complete, the primary publishes new checkpoints to all replica copies, notifying them of a new segment being available for download.
QuickSight makes it straightforward for business users to visualize data in interactive dashboards and reports. An AWS Glue crawler scans data on the S3 bucket and populates table metadata on the AWS Glue Data Catalog. Select Publish new dashboard as , and enter GlueObservabilityDashboard. Choose Publish dashboard.
S3 Tables integration with the AWS Glue Data Catalog is in preview, allowing you to stream, query, and visualize dataincluding Amazon S3 Metadata tablesusing AWS analytics services such as Amazon Data Firehose , Amazon Athena , Amazon Redshift, Amazon EMR, and Amazon QuickSight. connection testing, metadata retrieval, and data preview.
Companies such as Adobe , Expedia , LinkedIn , Tencent , and Netflix have published blogs about their Apache Iceberg adoption for processing their large scale analytics datasets. . In CDP we enable Iceberg tables side-by-side with the Hive table types, both of which are part of our SDX metadata and security framework.
Hydro is powered by Amazon MSK and other tools with which teams can move, transform, and publish data at low latency using event-driven architectures. In the future, we plan to profile workloads based on metadata, cross-check them with capacity metrics, and place them in the appropriate MSK cluster.
In today’s world, we increasingly interact with the environment around us through data. published as a special topic article in AI magazine, Volume 43, Issue 1 , Spring 2022. The catalog stores the asset’s metadata in RDF. It acts as a catalog of assets that are involved in various publication processes.
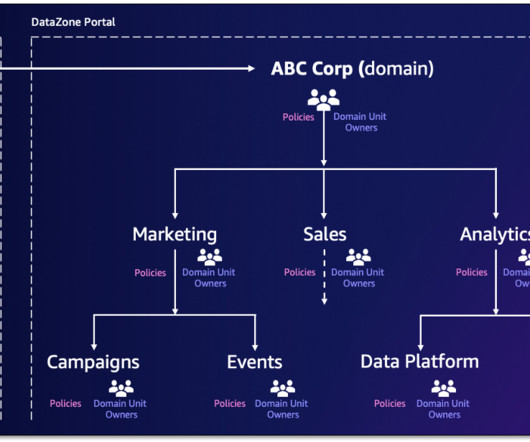
Additionally, authorization policies can be configured for a domain unit permitting actions such as who can create projects, metadata forms, and glossaries within their domain units. Several other child domain units with policies can be built within customer domain units, such as customer interactions and profiles.
It involves: Reviewing data in detail Comparing and contrasting the data to its own metadata Running statistical models Data quality reports. from the business interactions), but if not available, then through confirmation techniques of an independent nature. 2 – Data profiling. million a year.
After deployment, the user will have access to a Jupyter notebook, where they can interact with two datasets from ASDI on AWS: Coupled Model Intercomparison Project 6 (CMIP6) and ECMWF ERA5 Reanalysis. Solution overview Each day, the UK Met Office produces up to 300 TB of weather and climate data, a portion of which is published to ASDI.
Sources Data can be loaded from multiple sources, such as systems of record, data generated from applications, operational data stores, enterprise-wide reference data and metadata, data from vendors and partners, machine-generated data, social sources, and web sources. Also, datasets are accessed for ML, data exporting, and publishing needs.
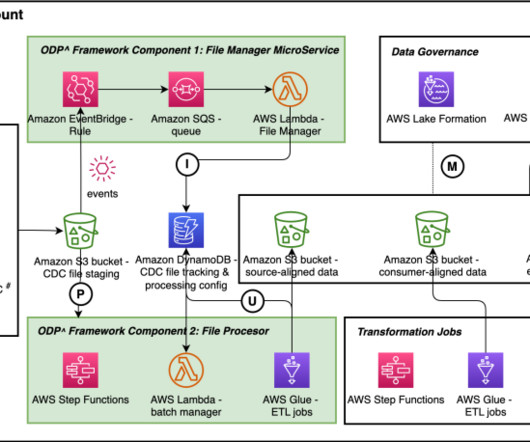
This enabled producers to publish data products that were curated and authoritative assets for their domain. The FinAuto team built AWS Cloud Development Kit (AWS CDK), AWS CloudFormation , and API tools to maintain a metadata store that ingests from domain owner catalogs into the global catalog.
Once a draft has been created or opened, developers use the visual Designer to build their data flow logic and validate it using interactive test sessions. Managing drafts outside the Catalog keeps a clean distinction between phases of the development cycle, leaving only those flows that are ready for deployment published in the Catalog.
They value NiFi’s visual, no-code, drag-and-drop UI, the 450+ out-of-the-box processors and connectors, as well as the ability to interactively explore data by starting individual processors in the flow and immediately seeing the impact as data streams through the flow. . Interactivity when needed while saving costs.
These models originate from different use cases: distributed knowledge representation and open data publishing on the web vs graph analytics designed to be as easy to start with as possible. Interesting attendee question : Should I model my data, such as start and end date, as metadata with embedded triples or as N-ary concepts?
Amazon API Gateway is a fully managed service that makes it straightforward for developers to create, publish, maintain, monitor, and secure APIs at any scale. The Lambda function queries OpenSearch Serverless and returns the metadata for the search. Based on metadata, content is returned from Amazon S3 to the user.
Under the Transparency in Coverage (TCR) rule , hospitals and payors to publish their pricing data in a machine-readable format. The Data Catalog contains the table definition, which contains metadata about the data in the machine-readable file. The tables are written to a database, which acts as a container.
More recently, they’ve been exploring the use of interactive chatbots to check the pulse of employee sentiment at work. KPMG, for example, built its first interactive chatbot in 2016. To fill this gap, some companies are turning to employee surveys aimed at gauging how workers are feeling. Some problems may be too big for AI to fix.
As AI becomes more pervasive, businesses need to feel confident that their models can be relied upon not to “hallucinate” facts or use inappropriate language when interacting with customers. 1] Users can access data through a single point of entry, with a shared metadata layer across clouds and on-premises environments.
Any type of metadata or universal data model is likely to slow down development and increase costs, which will affect the time to market and profit. In both cases, semantic metadata is the glue that turns knowledge graphs into hubs of data, metadata, and content. The diagram below illustrates this in a simplified form.
Common security, governance, metadata, replication, and automation enable CDP to operate as an integrated system. Integration, metadata and governance capabilities glue the individual components together.” . Our goal is to give every business the ability to achieve these same types of advantages to move faster in a much easier way.
McKnight Consulting Group recently published their own third party benchmark study comparing the price-performance of Cloudera Data Warehouse to 4 other prominent cloud data warehouse vendors. This provides consistent security and metadata architecture as CDW interacts with other services within CDP. Benchmark Description.
AWS has invested in native service integration with Apache Hudi and published technical contents to enable you to use Apache Hudi with AWS Glue (for example, refer to Introducing native support for Apache Hudi, Delta Lake, and Apache Iceberg on AWS Glue for Apache Spark, Part 1: Getting Started ).
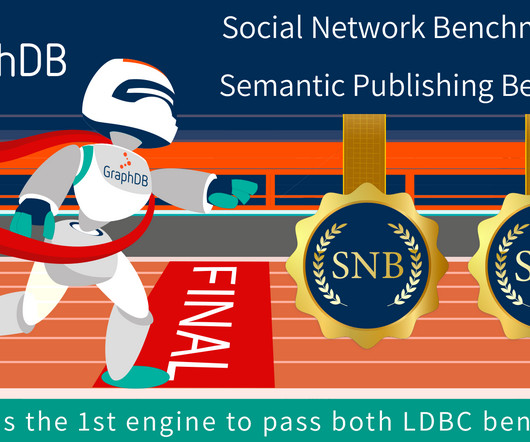
The engines must facilitate the advanced data integration and metadata data management scenarios where an EKG is used for data fabrics or otherwise serves as a data hub between diverse data and content management systems. GraphDB officially passed SNB’s Interactive Workload at scale factor 30 (SF30) – a graph of 1.5
OpenSearch Dashboards is a visualization and exploration tool that allows you to create, manage, and interact with visuals, dashboards, and reports based on the data indexed in your OpenSearch cluster. It defines one or more destinations to which a pipeline publishes records. The processor is an optional component of a pipeline.
Visualize AWS Glue Data Quality scores in Amazon DataZone You can now visualize AWS Glue Data Quality scores in data assets that have been published in the Amazon DataZone business catalog and that are searchable through the Amazon DataZone web portal. We use this data source to import metadata information related to our datasets.
In 2022, AWS published a dbt adapter called dbt-glue —the open source, battle-tested dbt AWS Glue adapter that allows data engineers to use dbt for cloud-based data lakes along with data warehouses and databases, paying for just the compute they need. The following diagram illustrates the architecture. impl=org.apache.iceberg.aws.s3.S3FileIO
Common security, governance, metadata, replication, and automation enable CDP to operate as an integrated system. Integration, metadata and governance capabilities glue the individual components together.” . Our goal is to give every business the ability to achieve these same types of advantages to move faster in a much easier way.
The images and referenced object’s metadata, such as height and width, coordinates of the bounding boxes, and individual classes, are saved in the PASCAL VOC data format as XML files. Image metadata such as properties and bounding box coordinates are saved as XML. Python-Labellmg interface.
This allows researchers to connect genetic information from NCBI Gene with protein data from UniProt, facilitating a more holistic understanding of gene-protein interactions. Building the knowledge graph The LLD Inventory team follows rigorous standards to generate metadata , which describes the data’s content, context, and structure.
This allows researchers to connect genetic information from NCBI Gene with protein data from UniProt, facilitating a more holistic understanding of gene-protein interactions. Building the knowledge graph The LLD Inventory team follows rigorous standards to generate metadata , which describes the data’s content, context, and structure.
It also adds flexibility in accommodating new kinds of data, including metadata about existing data points that lets users infer new relationships and other facts about the data in the graph. Taking additional advantage of the W3C RDF Schema (and optionally OWL) standards to publish data models describing the structure of published data.
We will publish follow up blogs for other data services. The table metadata is stored next to the data files under a metadata directory, which allows multiple engines to use the same table simultaneously. CDW separates the compute (Virtual Warehouses) and metadata (DB catalogs) by running them in independent Kubernetes pods.
We organize all of the trending information in your field so you don't have to. Join 42,000+ users and stay up to date on the latest articles your peers are reading.
You know about us, now we want to get to know you!
Let's personalize your content
Let's get even more personalized
We recognize your account from another site in our network, please click 'Send Email' below to continue with verifying your account and setting a password.


Let's personalize your content