This site uses cookies to improve your experience. To help us insure we adhere to various privacy regulations, please select your country/region of residence. If you do not select a country, we will assume you are from the United States. Select your Cookie Settings or view our Privacy Policy and Terms of Use.
Cookie Settings
Cookies and similar technologies are used on this website for proper function of the website, for tracking performance analytics and for marketing purposes. We and some of our third-party providers may use cookie data for various purposes. Please review the cookie settings below and choose your preference.
Used for the proper function of the website
Used for monitoring website traffic and interactions
Cookie Settings
Cookies and similar technologies are used on this website for proper function of the website, for tracking performance analytics and for marketing purposes. We and some of our third-party providers may use cookie data for various purposes. Please review the cookie settings below and choose your preference.
Strictly Necessary: Used for the proper function of the website
Performance/Analytics: Used for monitoring website traffic and interactions
Here, we will consider the question ‘ What are operationalreports,’ delve deeper into strategic reports, and examine a host of best operationalreporting analysis practices. Download: A pocket-sized guide to operational and strategic reports! What Is OperationalReporting? Let’s begin.
Often, companies generate written monthly, quarterly, or yearly reports that serve a number of purposes, but they do not provide the level of detailed insights that businesses require in order to succeed and stay ahead of their competition. This is where interactive weekly reports come into the picture. What Is A Weekly Report?
Operationalreports have the potential to greatly enhance business performance through the utilization of data-driven insights. These reports offer a structured and comprehensible representation of data, enabling a clearer understanding of complex issues that might otherwise remain elusive. What Is An OperationalReport?
—April 11, 2022— insightsoftware , a global provider of reporting, analytics, and performance management solutions that drive greater financial intelligence, today expanded the Angles product line , with the launch of new solutions for no-code operationalreporting for NetSuite and Deltek. Angles streamlines the process.
Speaker: Dean Yao, Sr. Director of Product Marketing, Logi Analytics
Operationalreports help get information to the people who need it most, in formats they understand, and in a timeframe that matters. Join the webinar to learn how embedding operationalreports can give your users a precisely formatted, ready-to-analyze view of their operational activities.
The traditional types of reporting don’t meet the requirements of today’s data management nor can they produce efficiency like an interactive dashboard where sets of data are presented in a complementary way. Save companies money by highlighting unnecessary operational costs. Encourages interactivity and analysis.
Recognizing a need for better operational analytics, insightsoftware leveraged award-winning technology from Logi Analytics to provide Oracle ERP Cloud users the ability to customize, create, and share interactive dashboards and reports across all departments of a business.
Although Oracle ERP Cloud provides very robust functionality, for the users in your organization who need to design, run, and distribute operationalreports, the ERP’s complexity presents some significant challenges. Speeding up financial and operationalreporting brings significant benefits to the organization as a whole.
In fact, a survey about management reports performed by Deloitte says that 50% of managers are unsatisfied with the speed of delivery and the quality of the reports they receive. But, with so many types of reports used on a daily basis, how can you know when to use them effectively? What Is The Report Definition?
Automated reports completely eliminate traditional means of communicating data since they rely on business reporting software that uses cutting edge business intelligence, technology and smart features such as interactivity, a drag-and-drop interface, and predictive analytics, among others.
Support Critical Decision-Making: Generate interactive, financial and operationalreports in Excel with detailed transaction insights for informed decision-making. Create Custom Reports in Minutes Directly in Excel Imagine being able to effortlessly create financial reports and analyses directly from Infor M3 in Excel.
Capacity monitoring dashboards As part of our platform management process, we conduct monthly operational reviews to maintain optimal performance. This involves analyzing an automated operationalreport that covers all the systems on the platform.
Through Modak Nabu’s profiling and indexing, Modak Nabu provides a comprehensive view of the curated datasets that are easily accessible to end-users — whether it’s Data Scientists building machine learning models or Data Analysts building operationalreports.
Event 1 Software delivers award-winning products—such as flagship solutions Office Connector and Liberty Reports—that enable CFOs and finance teams to transform Excel into an intuitive and interactivereporting engine for business data. Based in Vancouver, Wash.,
Key Benefits and Deliverables: Real-time report for Stocks, Sales, Returns, Regions etc., Key Benefits and Deliverables: Real-time report for Stocks, Sales, Returns, Regions etc., Download the Case study
The Smarten Augmented Analytics solution allows the Client users to interact with data to identify overall profitability at various levels in the organization. It also allowed the Client team to measure tactical and operational results at a summary level, and at a detailed level for an individual task, or a group achievement.
Identify and weigh the dimensions of service quality Just like FedEx examined its customer experience, start by assessing how various personas interact with IT. Identify the key operational capabilities your organization provides that visibly impact your constituents.
It is very hard to maintain interactive performance, over large amounts of data that is arriving very fast, some of which might need updates, with a large number of queries of varying patterns. Fast ingest of streaming data, interactive queries, very high scale. Tool for visualizing, dashboarding, and report building.
Smart View Reports provide a familiar, Excel-based spreadsheet environment in which you can interactively analyze General Ledger balances and define reports. Sunburst Visualization enables users to view account activity for key accounts across various business dimensions.
AI continues to transform customer engagements and interactions with chatbots that use predictive analytics for real-time conversations. Cloud-native apps, microservices and mobile apps drive revenue with their real-time customer interactions. Data quality is crucial for real-time actions because decisions often can’t be taken back.
One form of an operationalreport is a pixel-perfect operationalreport. Pixel-perfect reports are optimal for high-precision reporting. Other types of reports, however, are much more complicated. Reports can be sent in PDF, HTML, Excel, CSV, and other formats.
That happens when you understand viewer preferences and understand how audiences interact or consume content. Traditionally, media and entertainment companies only used data for basic operationalreporting. In the media and entertainment business, success is engaging viewers and creating “stickiness.”
Raleigh, N.C – August 4, 2022 – insightsoftware , a global provider of reporting, analytics, and performance management solutions, today announced the release of Logi Composer 7. Logi Composer offers completely customizable, low-code dashboards and interactive data visualizations. Enhanced data connectivity and security support.
Despite serving as a vital reflection of a company’s operational health, financial statements offer a more direct and nuanced portrayal of its operations compared to operationalreports. Users experience a well-designed and interactive page, showcasing simplicity in a two-dimensional layout.
When used as a data source for BI, such a model presents complex ERP data in a more consumable and understandable fashion, freeing BI reporting development from the significant complexity of ERP data structures, speeding development projects, and making BI reports and dashboards more relevant and more intuitive.
IT and finance team collaboration are key as new tools continue to be introduced, and three-quarters of finance departments (77%) often interact with IT for financial reporting. But while they are largely satisfied (88%) with their interactions with IT, 80 percent of finance teams also feel over-reliant on IT.
The data products used inside the company include insights from user journeys, operationalreports, and marketing campaign results, among others. Data analysts who require access to the raw assets on the data lake use Amazon Athena , a serverless, interactive analytics service for exploration with ad hoc queries.
Creating Interactive Visualisation for Actionable Analytics. Publishing and Administering Dashboards and Reports in Power BI for the Organisation. Creating Interactive Visualisation for Actionable Analytics. We will also learn how to configure Power Pivot to enable Power BI Q&A to build interactive visualisation.
Creating Interactive Visualisation for Actionable Analytics. Publishing and Administering Dashboards and Reports in Power BI for the Organisation. Creating Interactive Visualisation for Actionable Analytics. We will also learn how to configure Power Pivot to enable Power BI Q&A to build interactive visualisation.
Creating Interactive Visualisation for Actionable Analytics. Publishing and Administering Dashboards and Reports in Power BI for the Organisation. Continuing the previous module, attendees will learn a number of fundamental Data Modelling Patterns and DAX Patterns in Power Pivot that are useful for analytical and operationalreporting.
Creating Interactive Visualisation for Actionable Analytics. Publishing and Administering Dashboards and Reports in Power BI for the Organisation. Continuing the previous module, attendees will learn a number of fundamental Data Modelling Patterns and DAX Patterns in Power Pivot that are useful for analytical and operationalreporting.
Part III Business Intelligence for Reporting. Chapter 11 Designing OperationalReports with Reporting Services. Chapter 12 Visualizing Your Data Interactively with Power View. Chapter 10 Choosing the Right Business Intelligence Visualization Tool. Chapter 13 Exploring Geographic and Temporal Data with Power Map.
Part III Business Intelligence for Reporting. Chapter 11 Designing OperationalReports with Reporting Services. Chapter 12 Visualizing Your Data Interactively with Power View. Chapter 10 Choosing the Right Business Intelligence Visualization Tool. Chapter 13 Exploring Geographic and Temporal Data with Power Map.
If you have ever interacted with Impala in the past you would have encountered the Catalog Cache Service. This is especially useful when you have a lot of highly selective queries, which is common in some operationalreporting and regulatory compliance scenarios. More on this below. Metadata Caching.
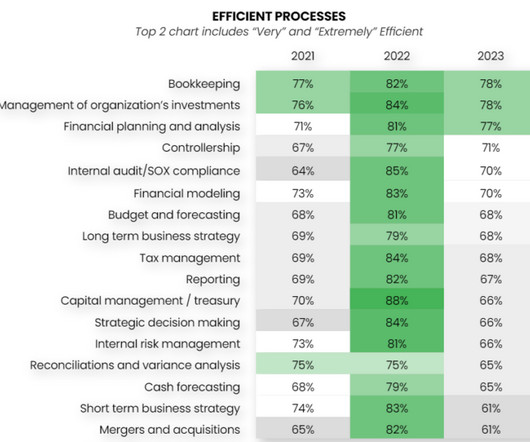
For example, interactive, real-time, refreshable reporting technology can save time on repetitive tasks and increase efficiency within your organization. The highest efficiencies are bookkeeping (78%), management of organization’s investments (78%), and financial planning and analysis (77%).
Although some product solutions disrupted the operationalreporting market, they require users to know the questions they need to ask their data. Interactively explore, combine, and shape diverse datasets into data ready for machine learning and AI applications. We agree with that. Sallam | Shubhangi Vashisth. . Free Trial.
Workday plans to embed Platfora technology into its technology foundation to complement existing operationalreporting, dashboarding and scorecarding capabilities with Platfora’s ad hoc exploration features targeted specifically for Workday’s HR and Finance application customers.
Finance teams are increasingly being asked for timely, recurring operationalreports to support day-to-day decision making. The most common challenges your finance team probably faces are: lengthy report creation time, existing tool complexity, and the inability to drill into transactional data. Download Now.
Enter operationalreporting, the change agent in our story. In the past year alone, a staggering 66% of IT decision-makers have witnessed a surge in requests for operationalreports. Recent findings highlight the increasing importance of operationalreporting and the significant impact it has on organizations.
As Business Intelligence (BI) tools, data warehousing solutions, and enterprise data and application landscapes have advanced, it’s worth taking the time to rethink that old model, starting with the dichotomy between operationalreporting (OR) and strategic analytics. OperationalReporting: Trends, Challenges, and the Key to Success.
Whether from your Oracle ERP Cloud or EBS (on-premises or implemented in a public or private cloud like Oracle Cloud Infrastructure or Azure), you must have the ability to efficiently transform that data into a format that works for your BI tools — for true, enterprise-wide reporting. Does This Challenge Sound Familiar? Access Resource.
With the help of operationalreporting software that delivers interactive visualizations and actionable insights from SAP data, your teams and leaders can respond to volatile market conditions and outpace your competition. Organize and Clean the Data You Rely On. Get a Demo.
Analytics are the gateway to understanding, enabling users to interact with and interpret the insights generated through data collection, preparation, and analysis. With Logi Symphony, equip your users with: Self-Service Analytics to empower non-technical users to interact with data independently.
It doesnt just work on static models; it adapts to your data and evolves with every user interaction. Continuous Learning: Improves over time by analyzing feedback and interactions For Product Managers, this means delivering standout features that users rely on. How Does It Work?
We organize all of the trending information in your field so you don't have to. Join 42,000+ users and stay up to date on the latest articles your peers are reading.
You know about us, now we want to get to know you!
Let's personalize your content
Let's get even more personalized
We recognize your account from another site in our network, please click 'Send Email' below to continue with verifying your account and setting a password.


Let's personalize your content