This site uses cookies to improve your experience. To help us insure we adhere to various privacy regulations, please select your country/region of residence. If you do not select a country, we will assume you are from the United States. Select your Cookie Settings or view our Privacy Policy and Terms of Use.
Cookie Settings
Cookies and similar technologies are used on this website for proper function of the website, for tracking performance analytics and for marketing purposes. We and some of our third-party providers may use cookie data for various purposes. Please review the cookie settings below and choose your preference.
Used for the proper function of the website
Used for monitoring website traffic and interactions
Cookie Settings
Cookies and similar technologies are used on this website for proper function of the website, for tracking performance analytics and for marketing purposes. We and some of our third-party providers may use cookie data for various purposes. Please review the cookie settings below and choose your preference.
Strictly Necessary: Used for the proper function of the website
Performance/Analytics: Used for monitoring website traffic and interactions
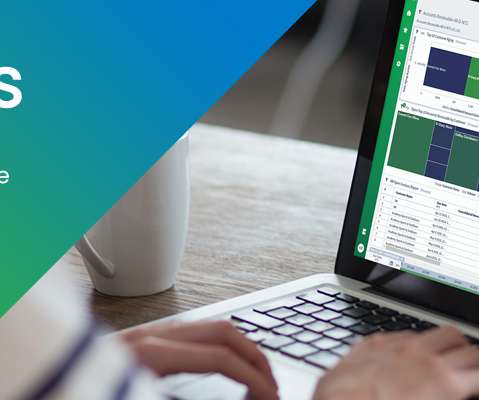
Capacity monitoring dashboards As part of our platform management process, we conduct monthly operational reviews to maintain optimal performance. This involves analyzing an automated operationalreport that covers all the systems on the platform.
insightsoftware, the leading provider of solutions for the Office of the CFO, is thrilled to introduce our new cloud connector for Infor M3 ERPs and Spreadsheet Server , our Excel-based reporting solution. With our cloud connector your team can work in an uninterrupted reporting environment before, during, and after your cloud migration.
It doesnt just work on static models; it adapts to your data and evolves with every user interaction. Continuous Learning: Improves over time by analyzing feedback and interactions For Product Managers, this means delivering standout features that users rely on. How Does It Work?
Speaker: Dean Yao, Sr. Director of Product Marketing, Logi Analytics
Operationalreports help get information to the people who need it most, in formats they understand, and in a timeframe that matters. Join the webinar to learn how embedding operationalreports can give your users a precisely formatted, ready-to-analyze view of their operational activities.
How do you ensure greater efficiency and accuracy for your financial reports? Here are five ways you can improve finance reporting efficiency, backed by our recent research into Oracle-driven finance teams. Embrace Finance Automation Oracle-driven finance teams contend with a wide range of automated financial reporting needs.
Weve seen incredible technological advancements that have produced business and financial reporting tools that streamline processes, create efficiencies, bridge skills gaps, and position organizations to react to an ever-increasing pace of market change with agility and confidence.
If you’re relying on JasperReports or Crystal Reports to power your data reporting and insights, you’ve likely heard the news: many popular versions are reaching end-of-life, and it’s time to start planning your next steps. If you’re a Crystal Reports user, the situation is just as pressing.
Info-Tech has released its 2025 Data Quadrant Report , which recognizes the best in technology solutions. Evaluating feedback from 3,433 users, this years report turned its focus toward business intelligence (BI) and analytics solutions that drive better decision-making for customers. How Did We Do? With an 8.3/10
When looking to streamline your existing processes, seek out technology thats easy enough to use for anyone on your finance team to create reports without advanced technical knowledge. It offers reporting and analytics in a single quick solution that fully understands and simplifies the complexity of JD Edwards.
Unlocking value requires visualizations that go further, enabling deeper interaction, advanced customization, and collaboration that provides deeper insights. Solution: Vizlib Custom Report The Vizlib Custom Report function empowers end users to create their own ad-hoc analyses without needing advanced technical knowledge.
Analytics are the gateway to understanding, enabling users to interact with and interpret the insights generated through data collection, preparation, and analysis. As users and stakeholders increasingly rely on your applications reporting, it strengthens your products stickiness and drives demand for additional seats.
Understanding of Power BI data models: To ensure the flows interact correctly with the report context and filters. Users can interact with buttons in the report to trigger actions like submitting approvals, updating records, or annotating data.
However, realizing the true potential of self-service analytics depends on adopting the right tools—solutions that not only simplify data interaction but also enhance collaboration and enable real-time, informed decision-making. This dependence limits efficiency and responsiveness.
Advanced Security: Supports Kerberos Authentication for secure data interactions. Enterprise-Ready: Offers departmental, enterprise, and global licensing options to fit various organizational needs.
Creating dashboards and reports shouldn’t require a technical background, or hours of your users’ time. Logi Symphony’s conversational BI enables: Intuitive interactions Seamless workflows In-product guidance Ready to learn more? That’s where conversational BI comes in.
Many finance professionals find themselves hampered by reporting limitations and heightened IT dependencies, which slows down decision-making and limits the value of their SAP data. This version of SAP encourages standardized processes to maintain performance but comes with the cost of easily being able to generate custom and ad hoc reports.
According to insightsoftware and Hanover Researchs recent Embedded Analytics Report , developers see AI as the most important trend of the next five years. At a high level, Logi Symphony embeds Logi AI through a simple chatbot with contextual information about your reports, dashboards, and more.
As a future path, BPC users can continue with SAP by moving to SAP Analytics Cloud (SAC) for planning and budgeting and S/4 HANA for group reporting. System discovery refers to the process of identifying, mapping, and understanding the various components, relationships, and interactions within a system. But is that a good approach?
By hosting Logi Symphony on Google’s cloud, your users gain fast, reliable access to real-time data, backed by Google’s unmatched security and consistent performance, ensuring seamless, secure interactions with critical insights.
Customer Satisfaction Index (CSI) Customer Satisfaction Index (CSI) is a metric that quantifies passengers’ satisfaction levels with various aspects of airline services, including check-in, onboard experience, and customer service interactions.
How to Create a Dashboard in 5 Simple Steps Developersnot designers or UI/UX expertsare usually the ones tasked with creating dashboards and reports. InteractivityInteractive dashboards engage users through features like video, overlays, drilldowns, and filters. Do you utilize wireframing as a design principle for dashboards?
To squeeze every last drop of value from your data, both in an operational and strategic sense, it’s important to leverage the right online reporting tool. When it comes to reporting, the daily running of your business, the plans and methods you formulate to improve the organization will steer your long-term success.
Overcoming 5 Key Reporting Challenges Download Now Why Seamless Excel Integration Matters Excel is a powerful and trusted tool, but when it comes to collaborative budgeting at scale, its limitations become clear. The result is a smarter, faster, and more resilient financial planning processwithout the overhead of additional payroll costs.
1) What Is A Weekly Report? 2) Why Are Weekly Progress Reports Important? 3) Weekly Report Templates & Examples. 4) Top Elements Of A Weekly Performance Report. This is where interactive weekly reports come into the picture. Your Chance: Want to build great weekly status reports on your own?
Issues like lack of interactivity, rigid chart options, and limited built-in collaboration features can make analytics feel more like a puzzle than a tool for insights. Vizlib provides that additional context and then some more; Enhanced visual options: Access a library of 40+ customizable visuals, from advanced charts to interactive maps.
At the same time, regulatory demands around tariffs and financial transparency and compliance, including Environmental, Social, and Governance (ESG) reporting, are intensifying, requiring more accurate, integrated data management.
Before we even realize our business potentials and want to act in our competitive market, there is always a new business plan to make, a new strategy to develop, a new report to generate – and they all take time. Your Chance: Want to test a professional reporting automation software? What Is An Automated Report?
Table of Contents 1) What Is The Report Definition? 2) Top 14 Types Of Reports 3) What Does A Report Look Like? Businesses have been producing reports since, forever. This presents a problem for many modern organizations today as building reports can take from hours to days. What Is The Report Definition?
Dashboards often are the best way to gain insight into an organization and its various departments, operations and performance. Well-built, focused dashboards easily serve up summaries and reports of the BI that’s most critical to the organization. Save companies money by highlighting unnecessary operational costs. Have no fear!
Operationalreports have the potential to greatly enhance business performance through the utilization of data-driven insights. These reports offer a structured and comprehensible representation of data, enabling a clearer understanding of complex issues that might otherwise remain elusive. What Is An OperationalReport?
April 11, 2022— insightsoftware , a global provider of reporting, analytics, and performance management solutions that drive greater financial intelligence, today expanded the Angles product line , with the launch of new solutions for no-code operationalreporting for NetSuite and Deltek. RALEIGH, N.C.
Although Oracle ERP Cloud provides very robust functionality, for the users in your organization who need to design, run, and distribute operationalreports, the ERP’s complexity presents some significant challenges. calendar days, with the top 25 percent of reporting being able to close in just 4.8
Recognizing a need for better operational analytics, insightsoftware leveraged award-winning technology from Logi Analytics to provide Oracle ERP Cloud users the ability to customize, create, and share interactive dashboards and reports across all departments of a business.
The out-of-the-box reporting provided by big ERP vendors frequently fails to address the fundamental requirements of speed and agility, making it difficult for finance and accounting to achieve that vision for up-to-date financial intelligence to support time-critical processes. Limitations of the Oracle ERP Cloud Reporting Tools.
One form of an operationalreport is a pixel-perfect operationalreport. Pixel-perfect reports are optimal for high-precision reporting. What is Pixel-perfect Reporting? To illustrate another example in which accurate reporting at scale is essential , think of the healthcare industry.
Deal furthers mission to deliver powerful portfolio of enterprise software solutions for Office of the CFO; expands real-time financial reporting capabilities for top ERPs Sage and Viewpoint. Emphasis on accurate financial and operationalreporting in order to maintain cash flow is more important than ever. RALEIGH, N.C.
July 21, 2022 – insightsoftware , a global provider of reporting, analytics, and performance management solutions, today launched its annual Finance Team Trends Report. With 63 percent of finance teams now reporting a “high level” of digitization, they have become significantly more efficient in their day-to-day tasks.
This Client required augmented analytics and reporting capabilities within the confines of the Healthcare Information System and Revenue tracking reports required by the industry standards and its management team. Key Benefits and Deliverables: Real-time report for Stocks, Sales, Returns, Regions etc., Download the Case study
Through Modak Nabu’s profiling and indexing, Modak Nabu provides a comprehensive view of the curated datasets that are easily accessible to end-users — whether it’s Data Scientists building machine learning models or Data Analysts building operationalreports.
The Smarten Augmented Analytics solution allows the Client users to interact with data to identify overall profitability at various levels in the organization. It also allowed the Client team to measure tactical and operational results at a summary level, and at a detailed level for an individual task, or a group achievement.
Ad hoc exploration and scheduled reports. It is very hard to maintain interactive performance, over large amounts of data that is arriving very fast, some of which might need updates, with a large number of queries of varying patterns. Fast ingest of streaming data, interactive queries, very high scale. General Purpose RTDW.
AI continues to transform customer engagements and interactions with chatbots that use predictive analytics for real-time conversations. Cloud-native apps, microservices and mobile apps drive revenue with their real-time customer interactions. report they have established a data culture 26.5%
Identify and weigh the dimensions of service quality Just like FedEx examined its customer experience, start by assessing how various personas interact with IT. Identify the key operational capabilities your organization provides that visibly impact your constituents.
We organize all of the trending information in your field so you don't have to. Join 42,000+ users and stay up to date on the latest articles your peers are reading.
You know about us, now we want to get to know you!
Let's personalize your content
Let's get even more personalized
We recognize your account from another site in our network, please click 'Send Email' below to continue with verifying your account and setting a password.


Let's personalize your content