This site uses cookies to improve your experience. To help us insure we adhere to various privacy regulations, please select your country/region of residence. If you do not select a country, we will assume you are from the United States. Select your Cookie Settings or view our Privacy Policy and Terms of Use.
Cookie Settings
Cookies and similar technologies are used on this website for proper function of the website, for tracking performance analytics and for marketing purposes. We and some of our third-party providers may use cookie data for various purposes. Please review the cookie settings below and choose your preference.
Used for the proper function of the website
Used for monitoring website traffic and interactions
Cookie Settings
Cookies and similar technologies are used on this website for proper function of the website, for tracking performance analytics and for marketing purposes. We and some of our third-party providers may use cookie data for various purposes. Please review the cookie settings below and choose your preference.
Strictly Necessary: Used for the proper function of the website
Performance/Analytics: Used for monitoring website traffic and interactions
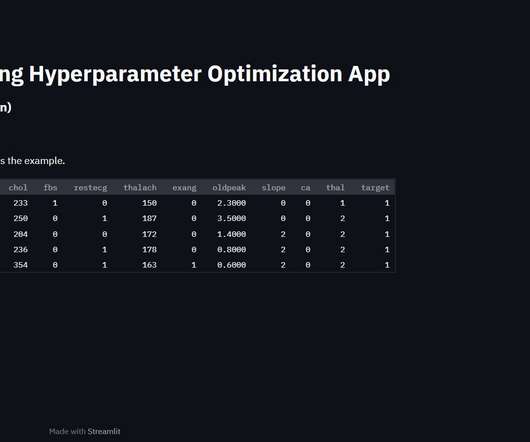
This article was published as a part of the Data Science Blogathon About Streamlit Streamlit is an open-source Python library that assists developers in creating interactive graphical user interfaces for their systems. Using Streamlit, we can quickly create interactive web apps and deploy them. Frontend […].
Overview: PSO is a stochastic optimization technique based on the movement and intelligence of swarms. In PSO, the concept of social interaction is used for solving a problem. The post An Introduction to Particle Swarm Optimization (PSO) Algorithm appeared first on Analytics Vidhya. Each particle in the swarm […].
It will be engineered to optimize decision-making and enhance performance in real-world complex systems. Introduction Reinforcement Learning from Human Factors/feedback (RLHF) is an emerging field that combines the principles of RL plus human feedback.
The dataset aims to optimize language model performance by addressing numerous […] The post Revolutionizing Virtual Assistant Interactions: PRESTO Dataset Tackles Multilingual NLU Challenges appeared first on Analytics Vidhya. It is designed to facilitate more realistic model training.
If the last few years have illustrated one thing, it’s that modeling techniques, forecasting strategies, and data optimization are imperative for solving complex business problems and weathering uncertainty. Uncover how an interactive web application can be built on top of your model.
This is where interactive weekly reports come into the picture. Armed with powerful visualizations and real-time data, modern weekly summary reports enable businesses to closely monitor their performance and the progress of their strategies to extract relevant insights and optimize their processes to ensure constant growth.
Introduction AI chatbots and assistants are transforming businesses across sectors these days by improving client relations and optimizing operations. They have become an indispensable part of the quickly changing digital sales landscape of 2024.
As businesses increasingly rely on digital platforms to interact with customers, the need for advanced tools to understand and optimize these experiences has never been greater. While Felix AI already enables businesses to process data at scale and act on insights faster, the potential for further automation and optimization is vast.
Microsoft’s OmniParser V2 is a cutting-edge AI screen parser that extracts structured data from GUIs by analyzing screenshots, enabling AI agents to interact with on-screen elements seamlessly. Perfect for building autonomous GUI agents, this tool is a game-changer for automation and workflow optimization.
By significantly compressing the time between steps in a collaborative process, this type of software can shorten cycles in cases where the degree of complexity in human interactions and their required coordination is relatively high. In theory, and described at a high level, any agentic system can do almost anything.
This comprehensive guide aims to assist content creators in optimizing their prompts to generate more accurate and relevant AI-generated content. With the increasing reliance on AI in various industries, this guide is set to revolutionize the way we interact with […] The post Are Your Prompts Powerful Enough?
Trading: GenAI optimizes quant finance, helps refine trading strategies, executes trades more effectively, and revolutionizes capital markets forecasting. Financial institutions have an unprecedented opportunity to leverage AI/GenAI to expand services, drive massive productivity gains, mitigate risks, and reduce costs.
How synthetic data can accelerate iteration before real users interact with the system. If the student finds the interaction helpful. Keeping the goal of finding the interaction helpful but recognizing that this contains a lot of other concerns, such as clarity, concision, tone, and correctness. How will you measure success?
And granted, a lot can be done to optimize training (and DeepMind has done a lot of work on models that require less energy). We can obviously do that now, but I suspect that training these subsidiary models can be optimized. If that interaction is going to be productive, we will need a lot from AI.
The answer is modern agency analytics reports and interactive dashboards. Explore our 14 days free trial & benefit from interactive agency reports! Agencies benefit from interactive dashboard tools to prove the success of their strategies and campaigns to clients. What Are Agency Analytics?
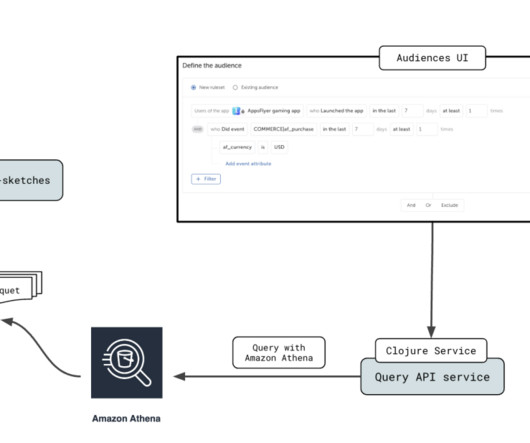
AppsFlyer empowers digital marketers to precisely identify and allocate credit to the various consumer interactions that lead up to an app installation, utilizing in-depth analytics. It’s designed to make it straightforward for users to analyze data stored in Amazon Simple Storage Service (Amazon S3) using standard SQL queries.
Kevin Weil, chief product officer at OpenAI, wants to make it possible to interact with AI in all the ways that you interact with another human being. An agent is part of an AI system designed to act autonomously, making decisions and taking action without direct human intervention or interaction.
Also center stage were Infor’s advances in artificial intelligence and process mining as well as its environmental, social and governance application and supply chain optimization enhancements. Optimize workflows by redesigning processes based on data-driven insights. Establish and support continuous improvement initiatives.
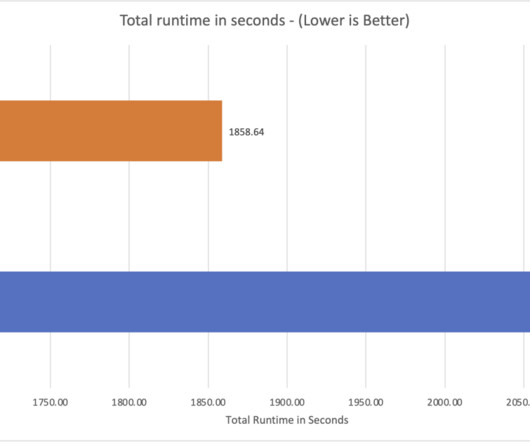
Amazon Athena is a serverless, interactive analytics service built on open source frameworks, supporting open table file formats. Starting today, the Athena SQL engine uses a cost-based optimizer (CBO), a new feature that uses table and column statistics stored in the AWS Glue Data Catalog as part of the table’s metadata.
Data dashboards provide a centralized, interactive means of monitoring, measuring, analyzing, and extracting a wealth of business insights from relevant datasets in several key areas while displaying aggregated information in a way that is both intuitive and visual. They Are Interactive. What Is A Data Dashboard? click to enlarge**.
The goals of such activities are to improve customer service, customer interactions, customer engagement, and customer experience (CX) through just-in-time customer assistance, personalization, and loyalty-building activities.
For example, if you’re using an AI chatbot to enhance customer experience, it’s critical that the training data is directly tied to real-world customer interactions. Capturing data from all relevant platforms — whether it’s web, mobile, or in-person interactions — ensures your AI has the insights it needs to deliver meaningful results.
These developments come as data shows that while the GenAI boom is real and optimism is high, not every organisation is generating tangible value so far. Alone, it is insufficient to respond effectively to interactions and deliver meaningful outcomes. For example, GenAI must be seen as a core element of the business strategy itself.
Every transaction, customer interaction, and operational process leaves a digital footprint. Hyper-personalization : AI-driven insights can analyze customer behavior, preferences, and past interactions to suggest the next best action. Businesses have never had access to more data than they do today. Need help navigating big data?
The status of digital transformation Digital transformation is a complex, multiyear journey that involves not only adopting innovative technologies but also rethinking business processes, customer interactions, and revenue models.
Amazon OpenSearch Service recently introduced the OpenSearch Optimized Instance family (OR1), which delivers up to 30% price-performance improvement over existing memory optimized instances in internal benchmarks, and uses Amazon Simple Storage Service (Amazon S3) to provide 11 9s of durability.
Iceberg offers distinct advantages through its metadata layer over Parquet, such as improved data management, performance optimization, and integration with various query engines. Iceberg provides a comprehensive SQL interface that allows quant teams to interact with their data using familiar SQL syntax.
Amazon OpenSearch Service introduced the OpenSearch Optimized Instances (OR1) , deliver price-performance improvement over existing instances. For more details about OR1 instances, refer to Amazon OpenSearch Service Under the Hood: OpenSearch Optimized Instances (OR1). OR1 instances use a local and a remote store.
They promise to revolutionize how we interact with data, generating human-quality text, understanding natural language and transforming data in ways we never thought possible. In retail, they can personalize recommendations and optimize marketing campaigns. This article reflects some of what Ive learned. And guess what?
Athena plays a critical role in this ecosystem by providing a serverless, interactive query service that simplifies analyzing vast amounts of data stored in Amazon Simple Storage Service (Amazon S3) using standard SQL. Next, use the dbt Cloud interactive development environment (IDE) to deploy your project.
Learn how to automate and reclaim valuable time with generative AI-powered assistants The post AI assistants optimize automation with API-based agents appeared first on IBM Blog. Training and enriching API-based agents for target use cases APIs are the backbone of AI agents.
With a powerful dashboard maker , each point of your customer relations can be optimized to maximize your performance while bringing various additional benefits to the picture. Professional CRM reporting technologies are interactive, customizable, and offer a wealth of potential when it comes to telling an effective story with your data.
Since humans process visual information 60.000 times faster than text , the workflow can be significantly increased by utilizing smart intelligence in the form of interactive, and real-time visual data. Today there are numerous ways in which a customer can interact with a specific company. Operational optimization and forecasting.
You can use big data analytics in logistics, for instance, to optimize routing, improve factory processes, and create razor-sharp efficiency across the entire supply chain. This isn’t just valuable for the customer – it allows logistics companies to see patterns at play that can be used to optimize their delivery strategies.
Modivcare, which provides services to better connect people with care, is on a transformative journey to optimize its services by implementing a new product operating model. I started to work with my business partners to define our capabilities at an aggregate level and ask some foundational questions: How do these capabilities interact?
Spreadsheets finally took a backseat to actionable and insightful data visualizations and interactive business dashboards. Prescriptive analytics can help you optimize scheduling, production, inventory, and supply chain design to deliver what your customers want in the most optimized way. Data exploded and became big.
By optimizing every single department and area of your business with powerful insights extracted from your own data you will ensure your business succeeds in the long run. Business intelligence tools provide you with interactive BI dashboards that serve as powerful communication tools to keep teams engaged and connected.
For example, process and task mining can uncover inefficiencies and identify opportunities for optimization, while RPA and low/no-code platforms can empower teams to automate repetitive tasks and develop solutions rapidly.
The rise of innovative, interactive, data-driven dashboard tools has made creating effective dashboards – like the one featured above – swift, simple, and accessible to today’s forward-thinking businesses. The interactive nature of data dashboards means that you can let go of PowerPoint-style presentations from the 90s.
Mike Lee, president and GM at AND Digital, says, In the travel and loyalty industry, generative AI is revolutionizing how customers interact with reward programs. One opportunity is for CIOs to help their marketing departments improve brand loyalty. Why should CIOs bet on unifying their data and AI practices?
While your keyboard is burning and your fingers try to keep up with your brain and comprehend all the data you’re writing about, using an interactive online data visualization tool to set specific time parameters or goals you’ve been tracking can bring a lot of saved time and, consequently, a lot of saved money. 1) Marketing CMO report.
Adopting hybrid and multi-cloud models provides enterprises with flexibility, cost optimization, and a way to avoid vendor lock-in. Cost Savings: Hybrid and multi-cloud setups allow organizations to optimize workloads by selecting cost-effective platforms, reducing overall infrastructure costs while meeting performance needs.
This in turn would increase the platform’s value for users and thus increase engagement, which would result in more eyes to see and interact with ads, which would mean better ROI on ad spend for customers, which would then achieve the goal of increased revenue and customer retention (for business stakeholders).
We organize all of the trending information in your field so you don't have to. Join 42,000+ users and stay up to date on the latest articles your peers are reading.
You know about us, now we want to get to know you!
Let's personalize your content
Let's get even more personalized
We recognize your account from another site in our network, please click 'Send Email' below to continue with verifying your account and setting a password.


Let's personalize your content