This site uses cookies to improve your experience. To help us insure we adhere to various privacy regulations, please select your country/region of residence. If you do not select a country, we will assume you are from the United States. Select your Cookie Settings or view our Privacy Policy and Terms of Use.
Cookie Settings
Cookies and similar technologies are used on this website for proper function of the website, for tracking performance analytics and for marketing purposes. We and some of our third-party providers may use cookie data for various purposes. Please review the cookie settings below and choose your preference.
Used for the proper function of the website
Used for monitoring website traffic and interactions
Cookie Settings
Cookies and similar technologies are used on this website for proper function of the website, for tracking performance analytics and for marketing purposes. We and some of our third-party providers may use cookie data for various purposes. Please review the cookie settings below and choose your preference.
Strictly Necessary: Used for the proper function of the website
Performance/Analytics: Used for monitoring website traffic and interactions
The hype around large language models (LLMs) is undeniable. They promise to revolutionize how we interact with data, generating human-quality text, understanding natural language and transforming data in ways we never thought possible. Tableau, Qlik and Power BI can handle interactive dashboards and visualizations.
Spreadsheets finally took a backseat to actionable and insightful data visualizations and interactive business dashboards. However, businesses today want to go further and predictive analytics is another trend to be closely monitored. Over the past decade, business intelligence has been revolutionized. Data exploded and became big.
For example, a complex sophisticated model for finding duplicates or matching schema is the least of our worries if we cannot even enumerate all possible pairs that need to be checked. HoloClean adopts the well-known “noisy channel” model to explain how data was generated and how it was “polluted.”
HoloClean decouples the task of data cleaning into error detection (such as recognizing that the location “cicago” is erroneous) and repairing erroneous data (such as changing “cicago” to “Chicago”), and formalizes the fact that “data cleaning is a statistical learning and inference problem.”
To fully leverage the power of data science, scientists often need to obtain skills in databases, statistical programming tools, and data visualizations. It helps to automate and makes the usage of the R programming statistical language easier and much more effective. perfect for statistical computing and design.
While some experts try to underline that BA focuses, also, on predictivemodeling and advanced statistics to evaluate what will happen in the future, BI is more focused on the present moment of data, making the decision based on current insights. What Is Business Intelligence And Analytics?
Statistical methods for analyzing this two-dimensional data exist. This statistical test is correct because the data are (presumably) bivariate normal. When there are many variables the Curse of Dimensionality changes the behavior of data and standard statistical methods give the wrong answers. Data Has Properties.
What is the point of those obvious statistical inferences? The point is that the 100% association between the event and the preceding condition has no special predictive or prescriptive power. How do predictive and prescriptive analytics fit into this statistical framework?
Data science is a method for gleaning insights from structured and unstructured data using approaches ranging from statistical analysis to machine learning. Some common tools include: SAS” This proprietary statistical tool is used for data mining, statistical analysis, business intelligence, clinical trial analysis, and time-series analysis.
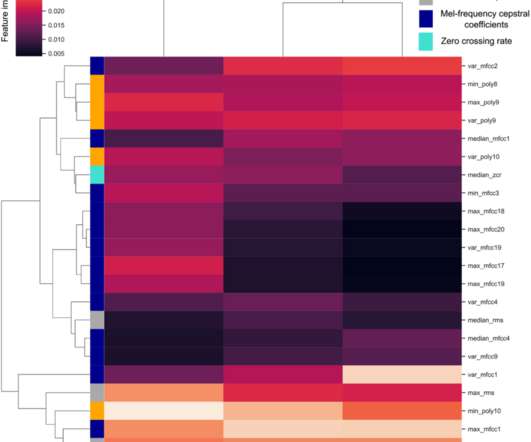
While most of these signals are implicitly communicated during human-to-human interaction, we do not have a method for quantifying feeling and mood through individual behavioral signals expressed on the digital platform. Summary statistics (i.e. Improvements in AUC values across models were also accompanied by increased precision?
Predictivemodeling efforts rely on dataset profiles , whether consisting of summary statistics or descriptive charts. Results become the basis for understanding the solution space (or, ‘the realm of the possible’) for a given modeling task. Each dataset has properties that warrant producing specific statistics or charts.
Classical statistics, developed in the 20 th century for small datasets, do not work for data where the number of variables is much larger than the number of samples (Large P Small N, Curse of Dimensionality, or P >> N data). Predictivemodels fit to noise approach 100% accuracy. Antimicrobial. Autoimmunity. IL-4, IL-13.
Candidates are required to complete a minimum of 12 credits, including four required courses: Algorithms for Data Science, Probability and Statistics for Data Science, Machine Learning for Data Science, and Exploratory Data Analysis and Visualization. Candidates have 90 minutes to complete the exam.
Through a marriage of traditional statistics with fast-paced, code-first computer science doctrine and business acumen, data science teams can solve problems with more accuracy and precision than ever before, especially when combined with soft skills in creativity and communication. Math and Statistics Expertise.
Without a doubt, it’s a big technological advancement, and one of the big statistics buzzwords, but the extent to which it is believed to be already applied is vastly exaggerated. The commercial use of predictive analytics is a relatively new thing. The accuracy of the predictions depends on the data used to create the model.
The data science path you ultimately choose will depend on your skillset and interests, but each career path will require some level of programming, data visualization, statistics, and machine learning knowledge and skills. On-site courses are available in Munich. Remote courses are also available. Switchup rating: 5.0 (out Data Science Dojo.
To that end, CAIOs must break down silos and interact with a multitude of leaders in both lines of business and supporting functions, Daly says. And they should have a proficiency in data science and analytics to effectively leverage data-driven insights and develop AI models.
“Users can analyze and interact with data with full visibility of dashboards, reports and other BI objects.” The Smarten Augmented Analytics and BI platform allows business users to leverage deep dive analysis using highly interactive dashboards, reports and NLP search on a mobile device.
BI Reports can vary in their interactivity. Static reports cannot be changed by the end-users, while interactive reports allow you to navigate the report through various hierarchies and visualization elements. Interactive reports support drilling down or drilling through multiple data levels at the click of a mouse.
Responsibilities include building predictivemodeling solutions that address both client and business needs, implementing analytical models alongside other relevant teams, and helping the organization make the transition from traditional software to AI infused software.
Two years later, I published a post on my then-favourite definition of data science , as the intersection between software engineering and statistics. I was very comfortable with that definition, having spent my PhD years on several predictivemodelling tasks, and having worked as a software engineer prior to that.
This article provides a brief explanation of the definition and uses of the Descriptive Statistics algorithms. What is a Descriptive Statistics? Descriptive statistics helps users to describe and understand the features of a specific dataset, by providing short summaries and a graphic depiction of the measured data.
Figure 1 includes a good illustration of different data sets and how they fall along these two size-related dimensions (For the interested reader, check out the figure in an interactive graphic ). Machine Learning and PredictiveModeling of Customer Churn. segmentation on steroids).
Artificial Intelligence (AI) and Machine Learning (ML) elements support Citizen Data Scientists and help users prepare data, achieve automated data insights and create, share and use predictivemodels. Users can harness the power of statistics and machine learning to uncover hidden insights and improve the overall quality of your data.
I’ve implemented DataView in my own work and find it an excellent way to organize investment information, do data discovery and create predictivemodels. Application #2: Creating and visualizing multi-variable relationships, which is particularly useful in creating predictivemodels. Is momentum important? And so on.
In a previous blog , we have covered how Pandas Profiling can supercharge the data exploration required to bring our data into a predictivemodelling phase. We covered the importance of Exploratory Analytics including observing the frequency of missing data and computing interactions of all features. Pandas Profiler.
For example, a Data Scientist can use PMML integration to Import models created in other languages like R and Python with a PMML format, and use those models with analytical workflows to roll out predictivemodels to users, enabling business users to participate in analysis and making Data Scientists more productive.
Predictive Analytics utilizes various techniques including association, correlation, clustering, regression, classification, forecasting and other statistical techniques. The cost of acquiring and interacting with customers can be expensive and each time a business loses a customer, it must spend money to replace the customer.
It is very hard to maintain interactive performance, over large amounts of data that is arriving very fast, some of which might need updates, with a large number of queries of varying patterns. Fast ingest of streaming data, interactive queries, very high scale. Mutability, random access, fast scans, interactive queries.
The early versions of AI were capable of predictivemodelling (e.g., The four categories of predictivemodelling, robotics, speech and image recognition are collectively known as algorithm-based AI or Discriminative AI. It offers customers and the insurer’s system to interact in a human-like manner.
Smarten CEO, Kartik Patel says, ‘Smarten SnapShot supports the evolving role of Citizen Data Scientists with interactive tools that allow a business user to gather information, establish metrics and key performance indicators.’
Assisted PredictiveModeling and Auto Insights to create predictivemodels using self-guiding UI wizard and auto-recommendations The Future of AI in Analytics The C=suite executive survey revealed that 93% felt that data strategy is critical to getting value from generative AI, but a full 57% had made no changes to their data.
The foundation of predictive analytics is based on probabilities. To generate accurate probabilities of future behavior, predictive analytics combine historical data from any number of applications with statistical algorithms. A well-designed credit scoring algorithm will properly predict both the low- and high-risk customers.
By OMKAR MURALIDHARAN, NIALL CARDIN, TODD PHILLIPS, AMIR NAJMI Given recent advances and interest in machine learning, those of us with traditional statistical training have had occasion to ponder the similarities and differences between the fields. Large scale prediction systems are often bad at counterfactual predictions out of the box.
Instead of using explicit instructions for performance optimization, ML models rely on algorithms and statisticalmodels that deploy tasks based on data patterns and inferences. In other words, ML leverages input data to predict outputs, continuously updating outputs as new data becomes available.
There are three major strategies: manual techniques based on our knowledge of the problem and the data, random sampling techniques that use coin flipping to keep or discard data, and model-based techniques that attempt to keep features that interact well with our learning model. Relationships and Interactions.
Let’s further pretend you’re starting out with the aim of doing a big predictivemodeling thing using machine learning. Summary statistics are not your friend – they may in fact lead you astray. This is level seven – when you interact with your stakeholders using data. I hope you enjoy that sort of thing.
This simplification allows stakeholders to grasp the underlying patterns and trends within the data without getting lost in the complexity of raw numbers and statistics. Interactivity: Incorporating interactive features allows users to explore the data more deeply, gaining comprehensive insights from the visualizations.
As a result, there has been a recent explosion in individual statistics that try to measure a player’s impact. The describe function on a Pandas DataFrame provides descriptive statistics, including the number of columns, in this case 27, and median (this is the 50 percent row), for each column. 05) in predicting changes in attendance.
Finally, through a case study of a real-world prediction problem, we also argue that Random Effect models should be considered alongside penalized GLM's even for pure prediction problems. Random effects models are a useful tool for both exploratory analyses and prediction problems. hi-fly-airlines 123.com
As Springboard notes, ‘Augmented Analytics is an example of human machine interaction in the data science field.’ The augmented analytics solution is typically supported by natural language processing (NLP) to support users in the query and results process.
Gartner defines a citizen data scientist as, ‘ a person who creates or generates models that leverage predictive or prescriptive analytics, but whose primary job function is outside of the field of statistics and analytics.’ Who is a Citizen Data Scientist?
Although it’s not perfect, [Note: These are statistical approximations, of course!] GloVe and word2vec differ in their underlying methodology: word2vec uses predictivemodels, while GloVe is count based. Interactive bokeh plot of two-dimensional word-vector data. Interactive bokeh plot of two-dimensional word-vector data.
Content creators and content consumers are connected, share information, and develop mental models of the world, along with shared or distinct realities, based on the information they consume. Online spaces are novel forms of community: people who haven’t met and may never meet in real life interacting in cyberspace.
We organize all of the trending information in your field so you don't have to. Join 42,000+ users and stay up to date on the latest articles your peers are reading.
You know about us, now we want to get to know you!
Let's personalize your content
Let's get even more personalized
We recognize your account from another site in our network, please click 'Send Email' below to continue with verifying your account and setting a password.


Let's personalize your content