10 GitHub Repositories to Master Statistics
KDnuggets
AUGUST 6, 2024
Learn statistics through interactive books, code examples, cheat sheets, guides, and tools documentation.
This site uses cookies to improve your experience. To help us insure we adhere to various privacy regulations, please select your country/region of residence. If you do not select a country, we will assume you are from the United States. Select your Cookie Settings or view our Privacy Policy and Terms of Use.
Cookies and similar technologies are used on this website for proper function of the website, for tracking performance analytics and for marketing purposes. We and some of our third-party providers may use cookie data for various purposes. Please review the cookie settings below and choose your preference.
Used for the proper function of the website
Used for monitoring website traffic and interactions
Cookies and similar technologies are used on this website for proper function of the website, for tracking performance analytics and for marketing purposes. We and some of our third-party providers may use cookie data for various purposes. Please review the cookie settings below and choose your preference.

KDnuggets
AUGUST 6, 2024
Learn statistics through interactive books, code examples, cheat sheets, guides, and tools documentation.

Analytics Vidhya
FEBRUARY 9, 2024
Python, with its rich ecosystem of libraries, stands at the forefront of data visualization, offering tools that range from simple plots to advanced interactive diagrams.
This site is protected by reCAPTCHA and the Google Privacy Policy and Terms of Service apply.

Analytics Vidhya
JUNE 25, 2022
Dear Readers, We’re getting Prabakaran Chandran on board to lead an interactive DataHour session with us. He is skilled in SQL, Python, R, Advanced Analytics, and Statistics. He has been working with Mu Sigma, a prestigious company as a Data and Decision Scientist that specializes in problem-solving, since 2019.

Analytics Vidhya
JUNE 9, 2023
Data visualization is an art that goes beyond numbers and statistics, […] The post Top 20 Data Visualization Examples appeared first on Analytics Vidhya. It is because they say a lot without actually saying anything. In today’s data-driven world, the quote holds more value than ever.
Advertisement
An interactive guide filled with the tools to turn your data into a competitive advantage. We’ve created this interactive playbook to help you use your data to provide actionable insights that will lead to better business decisions and customer outcomes. What do startups and Fortune 500 companies have in common?

Smart Data Collective
SEPTEMBER 22, 2021
In this blog post, we discuss the key statistics and prevention measures that can help you better protect your business in 2021. Cyber fraud statistics and preventions that every internet business needs to know to prevent data breaches in 2021. Avoid interacting with suspicious links. But you can come around this.

datapine
MARCH 25, 2019
Conduct statistical analysis. One of the most pivotal types of data analysis methods is statistical analysis. Regression: A definitive set of statistical processes centered on estimating the relationships among particular variables to gain a deeper understanding of particular trends or patterns.

CIO Business Intelligence
FEBRUARY 6, 2025
They promise to revolutionize how we interact with data, generating human-quality text, understanding natural language and transforming data in ways we never thought possible. Tableau, Qlik and Power BI can handle interactive dashboards and visualizations. In life sciences, simple statistical software can analyze patient data.

CIO Business Intelligence
APRIL 9, 2025
Since the AI chatbots 2022 debut, CIOs at the nearly 4,000 US institutions of higher education have had their hands full charting strategy and practices for the use of generative AI among students and professors, according to research by the National Center for Education Statistics.
AWS Big Data
JULY 10, 2024
The new data preparation interface in AWS Glue Studio provides an intuitive, spreadsheet-style view for interactively working with tabular data. Create an IAM role for the console user Complete the following steps to create the IAM role to interact with the console: On the IAM console, in the navigation pane, choose Role.

datapine
MARCH 31, 2022
For example, if you enjoy computer science, programming, and data but are too extroverted to program all day long, you could work in a more human-oriented area of intelligence for business, perhaps involving more face-to-face interactions than most programmers would encounter on the job. BI engineer.

O'Reilly on Data
MARCH 24, 2020
HoloClean decouples the task of data cleaning into error detection (such as recognizing that the location “cicago” is erroneous) and repairing erroneous data (such as changing “cicago” to “Chicago”), and formalizes the fact that “data cleaning is a statistical learning and inference problem.”

datapine
JANUARY 24, 2021
You’ll want to be mindful of the level of measurement for your different variables, as this will affect the statistical techniques you will be able to apply in your analysis. There are basically 4 types of scales: *Statistics Level Measurement Table*. 5) Which statistical analysis techniques do you want to apply?

O'Reilly on Data
JUNE 18, 2019
The good news is that researchers from academia recently managed to leverage that large body of work and combine it with the power of scalable statistical inference for data cleaning. business and quality rules, policies, statistical signals in the data, etc.).

O'Reilly on Data
NOVEMBER 13, 2018
There are also many important considerations that go beyond optimizing a statistical or quantitative metric. As we deploy ML in many real-world contexts, optimizing statistical or business metics alone will not suffice. David Talby summarized some of these key challenges in a recent post : Your models may start degrading in accuracy.

datapine
AUGUST 14, 2019
To fully leverage the power of data science, scientists often need to obtain skills in databases, statistical programming tools, and data visualizations. It helps to automate and makes the usage of the R programming statistical language easier and much more effective. perfect for statistical computing and design.

datapine
MARCH 25, 2022
While some experts try to underline that BA focuses, also, on predictive modeling and advanced statistics to evaluate what will happen in the future, BI is more focused on the present moment of data, making the decision based on current insights. But let’s see in more detail what experts say and how can we connect and differentiate the both.

datapine
NOVEMBER 27, 2019
Spreadsheets finally took a backseat to actionable and insightful data visualizations and interactive business dashboards. ARIMA techniques are complex and drawing conclusions from the results may not be as straightforward as for more basic statistical analysis approaches. Data exploded and became big.

datapine
MAY 27, 2020
While analytical reporting is based on statistics, historical data and can deliver a predictive analysis of a specific issue, its usage is also spread in analyzing current data in a wide range of industries. But with dynamic, interactive dashboard reporting software , your structure will be far simpler and more holistic.
DataKitchen
APRIL 11, 2024
Statistical Process Control in Data Operations: Gil touched upon applying statistical process control techniques to data operations to monitor and control data quality and process performance. Interactive Segments: Throughout the webinar, participants were encouraged to consider applying the concepts discussed to their operations.

Rocket-Powered Data Science
JULY 7, 2019
Chatbots cannot hold long, continuing human interaction. Traditionally they are text-based but audio and pictures can also be used for interaction. They provide more like an FAQ (Frequently Asked Questions) type of an interaction. Consequently, they can have extended adaptable human interaction. 4) Prosthetics.

datapine
MARCH 6, 2023
Recent statistics suggest that as much as 20% of employees churn within the first 45 days of employment, but on the flip side, a great onboarding experience ensures 69% of employees stick with a company for three years. The results can later be displayed in an interactive HR report.

CIO Business Intelligence
FEBRUARY 14, 2023
Research shows eliminating this time using Identity-centered Security can save as much as $3 a call , creating the potential for millions in annual savings while at the same time providing a better customer experience.

CIO Business Intelligence
NOVEMBER 14, 2022
Decision support systems definition A decision support system (DSS) is an interactive information system that analyzes large volumes of data for informing business decisions. Commonly used models include: Statistical models. Dashboards and other user interfaces that allow users to interact with and view results.

datapine
JANUARY 6, 2022
More often than not, it involves the use of statistical modeling such as standard deviation, mean and median. Let’s quickly review the most common statistical terms: Mean: a mean represents a numerical average for a set of responses. Standard deviation: this is another statistical term commonly appearing in quantitative analysis.
Smart Data Collective
JUNE 10, 2022
The Bureau of Labor Statistics reports that there are over 105,000 data scientists in the United States. To work in this field, you will need strong programming and statistics skills and excellent knowledge of software engineering. Are you interested in a career in data science? This is the best time ever to pursue this career track.

O'Reilly on Data
JUNE 14, 2024
They are then able to take in prompts and produce outputs based on the statistical weights of the pretrained models of those corpora. While perfect intelligence is no more possible in a synthetic sense than in an organic sense, retrieval-augmented generative (RAG) search engines may be the key to addressing the many concerns we listed above.

datapine
SEPTEMBER 16, 2022
But often that’s how we present statistics: we just show the notes, we don’t play the music.” – Hans Rosling, Swedish statistician. They can be fun and interactive, too. 14) “Visualize This: The Flowing Data Guide to Design, Visualization, and Statistics” by Nathan Yau. datapine is filling your bookshelf thick and fast.

CIO Business Intelligence
MAY 20, 2022
The Machine Learning Department at Carnegie Mellon University was founded in 2006 and grew out of the Center for Automated Learning and Discovery (CALD), itself created in 1997 as an interdisciplinary group of researchers with interests in statistics and machine learning. University of Texas–Austin.

Rocket-Powered Data Science
OCTOBER 6, 2023
What is the point of those obvious statistical inferences? In statistical terms, the joint probability of event Y and condition X co-occurring, designated P(X,Y), is essentially the probability P(Y) of event Y occurring. How do predictive and prescriptive analytics fit into this statistical framework?

Smart Data Collective
JUNE 8, 2023
From interactive learning experiences to personalized tracking and statistics, QR codes offer immense potential for enhancing educational practices. Enhancing Learning with QR Codes QR codes provide educators with a powerful tool to engage and interact with learners by leveraging data analytics more effectively.

CIO Business Intelligence
APRIL 22, 2022
Data science is a method for gleaning insights from structured and unstructured data using approaches ranging from statistical analysis to machine learning. Some common tools include: SAS” This proprietary statistical tool is used for data mining, statistical analysis, business intelligence, clinical trial analysis, and time-series analysis.
Rocket-Powered Data Science
MARCH 10, 2020
Any interaction between the two ( e.g., a financial transaction in a financial database) would be flagged by the authorities, and the interactions would come under great scrutiny. Next, consider the anti-money laundering (AML) use case: person A and person C are under suspicion for illicit trafficking.
O'Reilly on Data
FEBRUARY 18, 2020
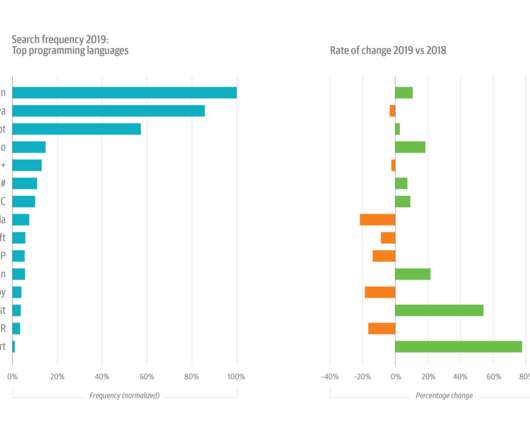
After several years of steady climbing—and after outstripping Java in 2017—Python-related interactions now comprise almost 10% of all usage. As statistics and related techniques become more important in software development, more programmers are encountering stats in programming classes.

Smart Data Collective
SEPTEMBER 13, 2023
Welcome to 2023, the age where screens are more than mere displays; they’re interactive communication portals, awash with data and always hungry for more. Modern digital signage is smart, connected, and more often than not, interactive. This is more than just an HD screen displaying a PowerPoint slideshow.

AWS Big Data
DECEMBER 17, 2024
A number of optimizations contribute to these speed-ups in performance, including integration with AWS Glue Data Catalog statistics, improved data and metadata filtering, dynamic partition elimination, faster/parallel processing of Iceberg manifest files, and scanner improvements.

Domino Data Lab
OCTOBER 7, 2020
Statistical methods for analyzing this two-dimensional data exist. This statistical test is correct because the data are (presumably) bivariate normal. When there are many variables the Curse of Dimensionality changes the behavior of data and standard statistical methods give the wrong answers. Data Has Properties.

AWS Big Data
JANUARY 9, 2025
Iceberg provides a comprehensive SQL interface that allows quant teams to interact with their data using familiar SQL syntax. Our benchmarks show that Iceberg performs comparably to direct Amazon S3 access, with additional optimizations from its metadata and statistics usage, similar to database indexing.
AWS Big Data
OCTOBER 14, 2024
Amazon Athena provides interactive analytics service for analyzing the data in Amazon Simple Storage Service (Amazon S3). Amazon EMR provides a big data environment for data processing, interactive analysis, and machine learning using open source frameworks such as Apache Spark, Apache Hive, and Presto.
DataKitchen
NOVEMBER 5, 2024
For example, if data about online customer interactions is delayed due to source system lags, the Gold layer’s customer segmentation analysis may fail to reflect recent behavior, leading to irrelevant or poorly targeted campaigns.

Smart Data Collective
SEPTEMBER 2, 2023
With better benchmarks, KPIs, and statistics , business leaders can better understand their environments and ultimately make more objective, logical decisions. Simply having a graph in front of you isn’t what enables you to make better business decisions; instead, it’s your interactions with data that really matter.

O'Reilly on Data
SEPTEMBER 11, 2018
They don’t move easily, but because each service contains just a few containers, statistical variations in load create havoc for neighboring containers creating a need to move them. An example of how pods interact to provide access to a shared data platform in a Kubernetes system. Here, we have two nodes, both running storage services.

Domino Data Lab
JANUARY 21, 2021
Predictive modeling efforts rely on dataset profiles , whether consisting of summary statistics or descriptive charts. Computing interactions of all features on a pairwise basis can be useful for selecting, or de-selecting, for further research. Each dataset has properties that warrant producing specific statistics or charts.
AWS Big Data
NOVEMBER 17, 2023
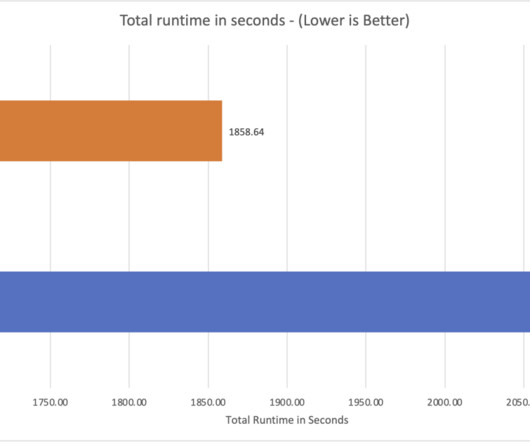
Amazon Athena is a serverless, interactive analytics service built on open source frameworks, supporting open table file formats. Starting today, the Athena SQL engine uses a cost-based optimizer (CBO), a new feature that uses table and column statistics stored in the AWS Glue Data Catalog as part of the table’s metadata.
Expert insights. Personalized for you.
We have resent the email to
Are you sure you want to cancel your subscriptions?


Let's personalize your content