This site uses cookies to improve your experience. To help us insure we adhere to various privacy regulations, please select your country/region of residence. If you do not select a country, we will assume you are from the United States. Select your Cookie Settings or view our Privacy Policy and Terms of Use.
Cookie Settings
Cookies and similar technologies are used on this website for proper function of the website, for tracking performance analytics and for marketing purposes. We and some of our third-party providers may use cookie data for various purposes. Please review the cookie settings below and choose your preference.
Used for the proper function of the website
Used for monitoring website traffic and interactions
Cookie Settings
Cookies and similar technologies are used on this website for proper function of the website, for tracking performance analytics and for marketing purposes. We and some of our third-party providers may use cookie data for various purposes. Please review the cookie settings below and choose your preference.
Strictly Necessary: Used for the proper function of the website
Performance/Analytics: Used for monitoring website traffic and interactions
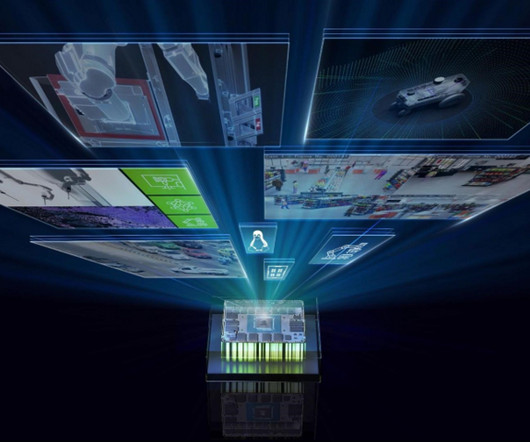
Introduction Visual Language Models (VLMs) are revolutionizing the way machines comprehend and interact with both images and text. Nvidia and MIT have recently launched a VLM named VILA, enhancing the capabilities of […] The post Nvidia Introduces VILA: Visual Language Intelligence and Edge AI 2.0
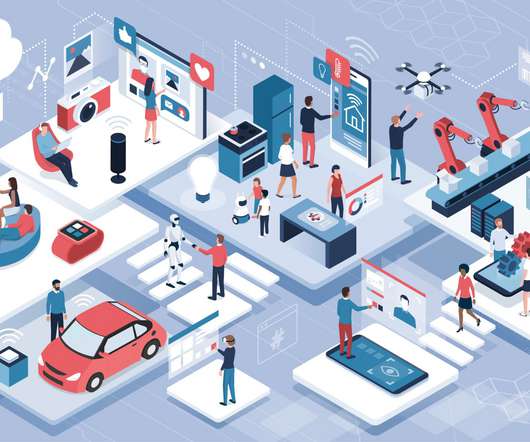
IoT solutions as well as Business Intelligence tools are widely used by companies all over the world to improve their processes. BI and IoT are a perfect duo as while IoT devices can gather important data in a real team, BI software is intended for processing and visualizing this information. Will it make sense?
If the work of a human’s mind can be somehow represented, interactive data visualization is the closest form of such representation right before pure art. So, what is Interactive data visualization and how are they driven by modern interactive data visualization tools? What is interactive data visualization software?
Cities are embracing smart city initiatives to address these challenges, leveraging the Internet of Things (IoT) as the cornerstone for data-driven decision making and optimized urban operations. According to IDC, the IoT market in the Middle East and Africa is set to surpass $30.2 Popular examples include NB-IoT and LoRaWAN.
Recently, EUROGATE has developed a digital twin for its container terminal Hamburg (CTH), generating millions of data points every second from Internet of Things (IoT)devices attached to its container handling equipment (CHE). Their terminal operations rely heavily on seamless data flows and the management of vast volumes of data.
With the massive explosion of data across the enterprise — both structured and unstructured from existing sources and new innovations such as streaming and IoT — businesses have needed to find creative ways of managing their increasingly complex data lifecycle to speed time to insight. Secure, Integrated Visualizations Native to CDP.
This article was published as a part of the Data Science Blogathon Introduction to Dynamic Time Wraping The Time series classification is a very common task where you will have data from various domains like Signal processing, IoT, human activity, and more and the ultimate aim is to train a specific model so that it can […].
Your first thought about the Internet of Things (IoT) might be of a “smart” device or sensor. However, building an IoT solution requires thought into six distinct layers, each with its own considerations and security implications. So, what are the six layers of IoT? Layer 1: IoT devices. Layer 2: Edge computing.
Exciting and futuristic, the concept of computer vision is based on computing devices or programs gaining the ability to extract detailed information from visual images. Visual analytics: Around three million images are uploaded to social media every single day. Artificial Intelligence (AI). Connected Retail.
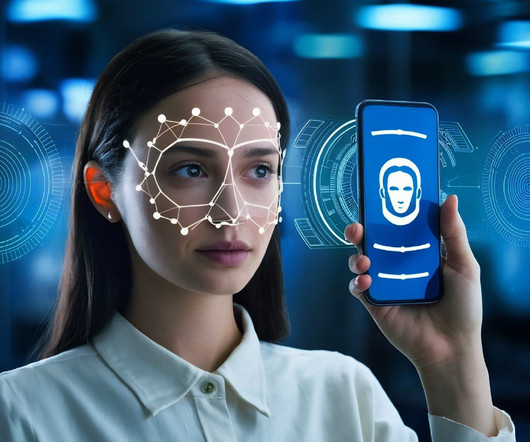
This blog post explores GhostFaceNets through captivating visuals and insightful illustrations, aiming to educate, motivate, and spark creativity. Introduction GhostFaceNets is a revolutionary facial recognition technology that uses affordable operations without compromising accuracy.
Thanks to cloud, Internet of Things (IoT), and 5G technologies, every link in the retail supply chain is becoming more tightly integrated. Transformation using these technologies is not just about finding ways to reduce energy consumption now,” says Binu Jacob, Head of IoT, Microsoft Business Unit, Tata Consultancy Services (TCS).
Imagine generating complex narratives from data visualizations or using conversational BI tools that respond to your queries in real time. Tableau, Qlik and Power BI can handle interactive dashboards and visualizations. In analytics, LLMs can create natural language query interfaces, allowing us to ask questions in plain English.
En route to one of those plants in Missouri, Kietermeyer explained to CIO.com that the combination IoT and edge platform, sensors, and edge analytics rules engine have been successfully employed to address pressure and temperature anomalies and the valve hardware issues that can occur in the diaper-making process.
Spreadsheets finally took a backseat to actionable and insightful data visualizations and interactive business dashboards. Companies are no longer wondering if data visualizations improve analyses but what is the best way to tell each data-story. 2) Data Discovery/Visualization. Data exploded and became big.
DataOps needs a directed graph-based workflow that contains all the data access, integration, model and visualization steps in the data analytic production process. However, these solutions are independent components of the data toolchain that collect, store, transform, visualize, and govern the data running through the pipeline.
In the long run, we see a steep increase in the proliferation of all types of data due to IoT which will pose both challenges and opportunities. What advances do you see in Visual Analytics in the next five years? There are three strong trends in Visual Analytics.
The Internet of Things (IoT) has revolutionized the way we interact with devices and gather data. Among the tools that have emerged from this digital transformation, IoT dashboards stand out as invaluable assets. IoT dashboards What is IoT Dashboard?
Moreover, within just five years, the number of smart connected devices in the world will amount to more than 22 billion – all of which will produce colossal sets of collectible, curatable, and analyzable data, claimed IoT Analytics in their industry report. Set up a report which you can visualize with an online dashboard.
You have probably heard a lot talk about the Internet of Things (IoT). The IoT sector is predicted to generate over £7.5 Smart building is the main area driving development in the IoT sector. They can, therefore, take advantage of the IoT sector to get actionable insights. trillion across the world. Do More with Less.
Now get ready as we embark on the second part of this series, where we focus on the AI applications with Kinesis Data Streams in three scenarios: real-time generative business intelligence (BI), real-time recommendation systems, and Internet of Things (IoT) data streaming and inferencing.
Due to the cloud-based, platform business model, possibilities will open up not only for operations and maintenance services around core digital twin models, but for value-added digital services wrapped around these twins such as visualization, collaboration, physical and cybersecurity, data analytics, and AI-enabled preventative maintenance.
Our command centres monitor a large number of freight locomotives across the globe, allowing us to visualize the locomotive’s location, and its servicing alerts. How is WABTEC leveraging emerging technologies like AI and IoT to enhance its manufacturing processes, as well as improve operational efficiency?
You can navigate to the projects Data page to visually verify the existence of the newly created table. Additionally, the notebook provides a chart view to visualize query results as graphs. Lets try a quick visualization to analyze the rating distribution. Under Create job , choose Visual ETL. option("url", jdbcurl).option("dbtable",
These include internet-scale web and mobile applications, low-latency metadata stores, high-traffic retail websites, Internet of Things (IoT) and time series data, online gaming, and more. Finally, to visualize BI insights, you can use Amazon QuickSight , a cloud-powered business analytics service. Choose Create data source.
Join SingleStore and IBM on September 21, 2022 for our webinar “ Accelerating Real-Time IoT Analytics with IBM Cognos and SingleStore ”. Why real-time analytics matters for IoT systems. IoT systems access millions of devices that generate large amounts of streaming data. Considering solutions for real-time analytics on IoT data.
An AI possesses qualities that include visual perception and tactile intelligence, which help advance e-signatures. Adopting Internet Of Things (IoT): The IoT system has a strong security feature that can detect forgery. So, how does AI lead to e-signature improvements? Read on to find out. Helps Stop E-Signature Forgery.
Some of the topics from the summit include: Data Science IoT Streaming Data AI Data Visualization. The focus of the event is data in the cloud (migrating, storing and machine learning). You can pre-register for the conference now.
Examples of an origin include storage systems like data lakes, data warehouses and data sources that include IoT devices, transaction processing applications, APIs or social media. It can be used to run analytical tools and power data visualization as well. Destination. The destination is decided by the use case of the data pipeline.
Computer Vision: Data Mining: Data Science: Application of scientific method to discovery from data (including Statistics, Machine Learning, data visualization, exploratory data analysis, experimentation, and more). They cannot process language inputs generally. Industry 4.0 Example applications: (1) High-definition and 3D video. (2)
In 2024, data visualization companies play a pivotal role in transforming complex data into captivating narratives. This blog provides an insightful exploration of the leading entities shaping the data visualization landscape. Let’s embark on a journey to uncover the top 10 Data Visualization Companies of 2024.
As organizations become data-driven and awash in an overwhelming amount of data from multiple data sources (AI, IoT, ML, etc.), That’s because it’s the only way to visualize metadata, and metadata is now the heart of enterprise data management and governance/ intelligence efforts. Constructing a Digital Transformation Strategy.
Whether it’s customer information, sales records, or sensor data from Internet of Things (IoT) devices, the importance of handling and storing data at scale with ease of use is paramount. A common use case that we see amongst customers is to search and visualize data.
Dickson, who joined the Wisconsin-based company in 2020, has launched PowerInsights, a homegrown digital platform that employs IoT and AI to deliver a geospatial visualization of Generac’s installed base of generators, as well as insights into sales opportunities.
In the subsequent post in our series, we will explore the architectural patterns in building streaming pipelines for real-time BI dashboards, contact center agent, ledger data, personalized real-time recommendation, log analytics, IoT data, Change Data Capture, and real-time marketing data.
IBM estimates that 90% of all data generated by the Internet of Things (IOT) is not analyzed, or utilized in business decision processes. As a starting point, there are a number of tools that utilize data visualization for businesses. For this reason, exploring data visualization can come in handy. Understanding performance.
This allows Azure to manage a completely hybrid infrastructure of: Azure, on-premise, IoT, and other cloud environments. Visual Studio Online. Hopefully, now is a better time for an in-browser IDE and Visual Studio Online will succeed. It’s true, I saw it happen this week. This is exactly what it sounds like.
It’s become a vital skill for producing mobile devices and for developing embedded systems, IoT devices, and other consumer products. Average salary: $168,636 Computer vision Computer vision is an area of AI focused on enabling computers to see the world as humans do, and to derive meaningful insights from visual inputs and digital images.
Jon Pruitt, director of IT at Hartsfield-Jackson Atlanta International Airport, and his team crafted a visual business intelligence dashboard for a top executive in its Emergency Response Team to provide key metrics at a glance, including weather status, terminal occupancy, concessions operations, and parking capacity. “The
At the beginning of April this year I attended the building IoT in Cologne. At the conference, which was organized by heise developer, iX and d.punkt publishing house, everything revolved around applications for the Internet of Things (IoT) and Industry 4.0 The evening was dedicated to Industrial IoT. took place here.
Nearly two-thirds of manufacturers globally already use cloud solutions, according to consulting firm McKinsey, and marketing intelligence company ReportLinker reports that the global smart factory market — consisting of companies using technology such as IoT — is expected to reach $214.2 billion by 2026.
At the beginning of April this year I was at the building IoT in Cologne. At the conference, which was organized by heise developer, iX and d.punkt publishing house, everything revolved around applications for the Internet of Things (IoT) and Industry 4.0 The evening was dedicated to Industrial IoT. took place here.
Emerging technologies such as artificial intelligence (AI), machine learning (ML), augmented reality (AR), the Internet of Things (IoT) and quantum computing can help organizations scale on demand, improve resiliency, minimize infrastructure investments and deploy solutions rapidly and securely. Visualize for Value.
It is a new-generation, multi-modal human-computer interaction system that can quickly create intelligent, visual, and interactive digital avatars. What is the Tencent Cloud AI Digital Human ? It facilitates enterprises’ intelligent service upgrades while supporting digital transformation and improving communication efficiency.
Geographic information systems (GIS ) visualize and make sense of this data, helping people and businesses better understand the patterns and relationships of our world. In its most recognizable form, a GIS visualization is what you see when you route a trip on Google Maps. ” can be answered by geospatial data and GIS.
We organize all of the trending information in your field so you don't have to. Join 42,000+ users and stay up to date on the latest articles your peers are reading.
You know about us, now we want to get to know you!
Let's personalize your content
Let's get even more personalized
We recognize your account from another site in our network, please click 'Send Email' below to continue with verifying your account and setting a password.


Let's personalize your content