This site uses cookies to improve your experience. To help us insure we adhere to various privacy regulations, please select your country/region of residence. If you do not select a country, we will assume you are from the United States. Select your Cookie Settings or view our Privacy Policy and Terms of Use.
Cookie Settings
Cookies and similar technologies are used on this website for proper function of the website, for tracking performance analytics and for marketing purposes. We and some of our third-party providers may use cookie data for various purposes. Please review the cookie settings below and choose your preference.
Used for the proper function of the website
Used for monitoring website traffic and interactions
Cookie Settings
Cookies and similar technologies are used on this website for proper function of the website, for tracking performance analytics and for marketing purposes. We and some of our third-party providers may use cookie data for various purposes. Please review the cookie settings below and choose your preference.
Strictly Necessary: Used for the proper function of the website
Performance/Analytics: Used for monitoring website traffic and interactions
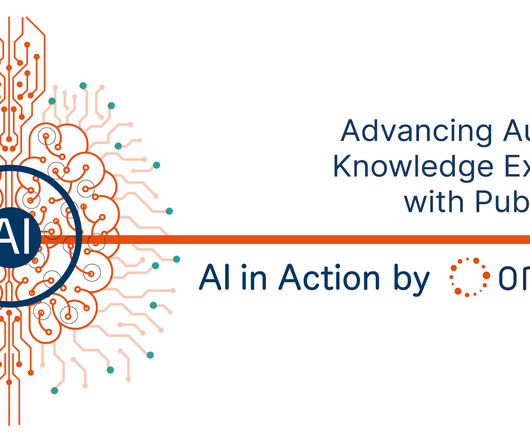
This is where PubMiner AI comes to help such interdisciplinary teams of biomedical researchers and data scientists in their journey to knowledge extraction. Finally, it enables building a subgraph representing the extracted knowledge, normalized to reference data sets. What is PubMiner AI?
Phase 3: Data Visualization. With the data analyzed and stored in spreadsheets, it’s time to visualize the data so that it can be presented in an effective and persuasive manner. Phase 4: KnowledgeDiscovery. It doesn’t matter what the project or desired outcome is, better data science workflows produce superior results.
One of the most imperative features of social BI is its ability to create self-served and user-generated analysis, coupled with the application of business user knowledge. This can be done with the help of socializing ideas within an Enterprise Business Intelligence tool, be it with or without an Enterprise Social Network (ESN).
Data analysis is a type of knowledgediscovery that gains insights from data and drives business decisions. Professional data analysts must have a wealth of business knowledge in order to know from the data what has happened and what is about to happen. At the same time, it also advocates visual exploratory analysis.
These are the so-called supercomputers, led by a smart legion of researchers and practitioners in the fields of data-driven knowledgediscovery. ExaMode, an acronym for Extreme-scale Analytics via Multimodal Ontology Discovery & Enhancement, is a project funded by the European Union, H2020 programme.
Although there is still no single, universally accepted definition, there have been various attempts at it – such as in Towards a Definition of Knowledge Graphs. Yet, the concept of knowledge graphs still lives without an agreed-upon description or shared understanding. There is diversity in terms of its implementation as well.
One of the most imperative features of social BI is its ability to create self-served and user-generated analysis, coupled with the application of business user knowledge. This can be done with the help of socializing ideas within an Enterprise Business Intelligence tool, be it with or without an Enterprise Social Network (ESN).
It is a process of using knowledgediscovery tools to mine previously unknown and potentially useful knowledge. It is an active method of automatic discovery. Data Visualization. Data visualization can reflect business operations intuitively. Hoewever, it can be a double-edged sword for enterprises.
These summaries, encapsulating key insights, are stored alongside the original content in the curated zone, enriching the organization’s data assets for further analysis, visualization, and informed decision-making. Let’s walk through the architecture chronologically for a closer look at each step.
Figure 3 shows visual explanation of how SMOTE generates synthetic observations in this case. Insufficient training data in the minority class — In domains where data collection is expensive, a dataset containing 10,000 examples is typically considered to be fairly large. Merging the two results in a completely balanced dataset (50:50).
Data mining is the process of discovering these patterns among the data and is therefore also known as KnowledgeDiscovery from Data (KDD). Domain Knowledge. The foremost step of this process is to possess relevant domain knowledge regarding the problem at hand. Deployment.
Knowledge Graphs are the Warp and Weft of a Data Fabric. Knowledge graphs can be used to foster text analysis and make this easier, as in the Ontotext Platform. In other words, knowledge graphs solve the data silo problem by making it irrelevant. What Makes a Data Fabric? It is a buzzword.
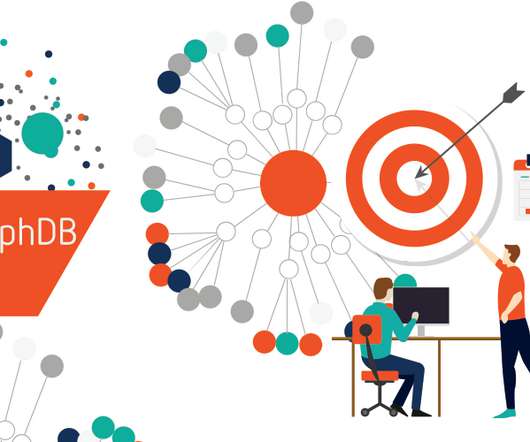
In our previous post, we covered the basics of how the Ontotext and metaphacts joint solution based on GraphDB and metaphactory helps customers accelerate their knowledge graph journey and generate value from it in a matter of days. You can also listen to our on-demand webinar on the same topic or check out our use case brief.
When analysing pharmacokinetic data to determine the degree of exposure of a drug and associated pharmacokinetic parameters (e.g., clearance, elimination half-life, maximum observed concentration ( ), time where the maximum concentration was observed ( ), Non-Compartmental Analysis (NCA) is usually the preferred approach [1]. Mean residence time.
However, for this to happen, there needs to be context for the data to become knowledge. Beyond that, and without a way to visualize, connect, and utilize the data, it’s still just a bunch of random information. It also creates a knowledge base to power growth through well-defined context and coherent systems.
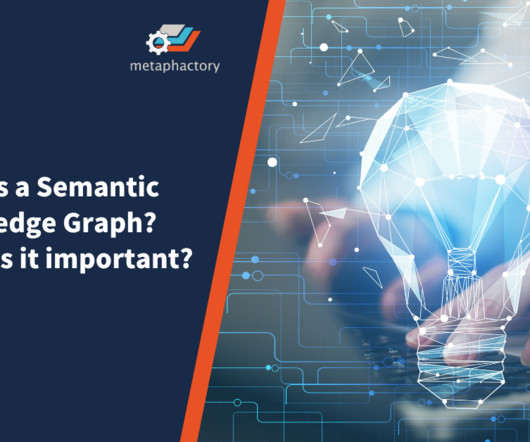
The growth of large language models drives a need for trusted information and capturing machine-interpretable knowledge, requiring businesses to recognize the difference between a semantic knowledge graph and one that isn’t—if they want to leverage emerging AI technologies and maintain a competitive edge. What is a knowledge graph?
Specifically, the increasing amount of data being generated and collected, and the need to make sense of it, and its use in artificial intelligence and machine learning, which can benefit from the structured data and context provided by knowledge graphs. We get this question regularly. Linked Data, subscriptions, purchased datasets, etc.).
This can be attributed to the popularity that machine learning algorithms, and more specifically deep learning, has been gaining in various domains. It is not possible to fully understand the inferential process of a deep neural network and to prove that it would generalise as expected. According to Fox et al.,
As a result, contextualized information and graph technologies are gaining in popularity among analysts and businesses due to their ability to positively affect knowledgediscovery and decision-making processes. Knowledge graph development: The Graph CoE should lead the development of each of the knowledge graph components.
We organize all of the trending information in your field so you don't have to. Join 42,000+ users and stay up to date on the latest articles your peers are reading.
You know about us, now we want to get to know you!
Let's personalize your content
Let's get even more personalized
We recognize your account from another site in our network, please click 'Send Email' below to continue with verifying your account and setting a password.


Let's personalize your content