This site uses cookies to improve your experience. To help us insure we adhere to various privacy regulations, please select your country/region of residence. If you do not select a country, we will assume you are from the United States. Select your Cookie Settings or view our Privacy Policy and Terms of Use.
Cookie Settings
Cookies and similar technologies are used on this website for proper function of the website, for tracking performance analytics and for marketing purposes. We and some of our third-party providers may use cookie data for various purposes. Please review the cookie settings below and choose your preference.
Used for the proper function of the website
Used for monitoring website traffic and interactions
Cookie Settings
Cookies and similar technologies are used on this website for proper function of the website, for tracking performance analytics and for marketing purposes. We and some of our third-party providers may use cookie data for various purposes. Please review the cookie settings below and choose your preference.
Strictly Necessary: Used for the proper function of the website
Performance/Analytics: Used for monitoring website traffic and interactions
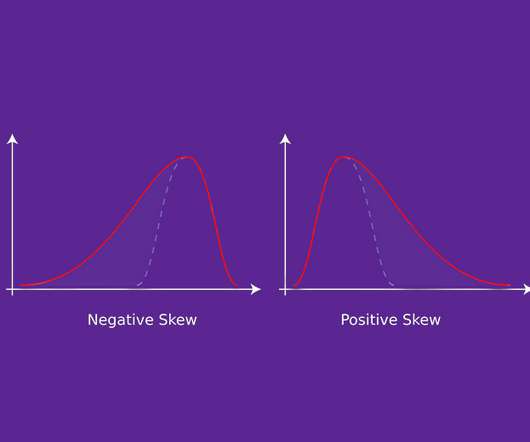
Overview Skewness is a key statistics concept you must know in the data science and analytics fields Learn what is skewness, the formula for. The post Statistics for Data Science: What is Skewness and Why is it Important? appeared first on Analytics Vidhya.
Applying statistical analysis to data and getting insights from it is our main objective. The post Statistical Inference Using Python appeared first on Analytics Vidhya. Introduction Hey folks! Data science is an emerging technology in the corporate society and it mainly deals with the data. A […].
The post Statistics for Data Science appeared first on Analytics Vidhya. ArticleVideo Book This article was published as a part of the Data Science Blogathon. It is the mark of truly intelligent person to be.
One such module is the statistics module, which provides a comprehensive set of functions for statistical operations. Introduction Python is a powerful programming language that offers a wide range of modules for various applications.
Speaker: John Mecke, Managing Director of DevelopmentCorporate, Jon Gatrell, Principal Partner at Market Driven Business
The ability to express complex concepts in numerical, financial, or statistical terms is critical, but it is often an overlooked discipline. In today’s Agile world, product managers are expected to be leaders in market knowledge, strategy, organizational enablement, etc. Numerical literacy is a key skill for effective product managers.
Introduction One of the most important applications of Statistics is looking into how two or more variables relate. The post Statistical Effect Size and Python Implementation appeared first on Analytics Vidhya. Hypothesis testing is used to look if there is any significant relationship, and we report it using a p-value.
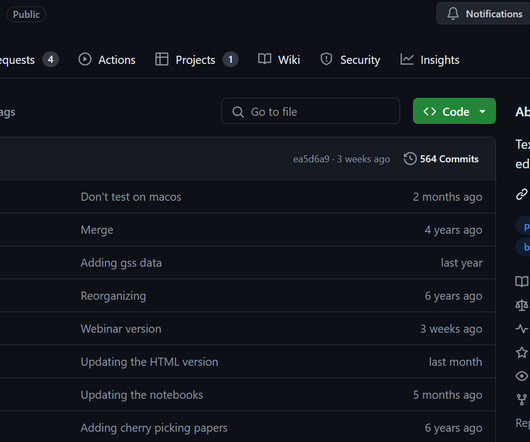
Introduction Statistics is a cornerstone of data science, machine learning, and many analytical domains. GitHub hosts numerous repositories that are excellent resources for anyone looking to deepen their statistical knowledge. Mastering it can significantly enhance your ability to interpret data and make informed decisions.
Introduction As Josh Wills once said, “A Data Scientist is a person who is better at statistics than any programmer and better at programming than any statistician“ Statistics is a fundamental tool when dealing with data and its analysis in Data Science. It provides […].
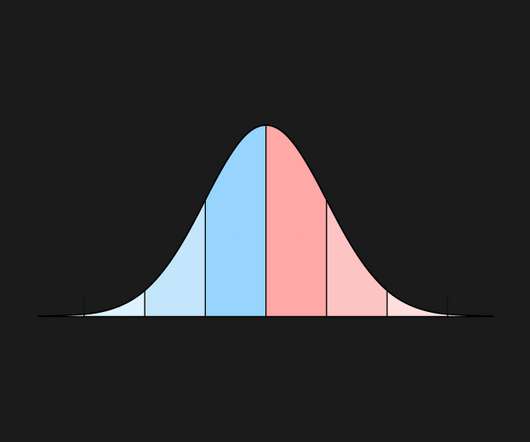
The post Statistics for Data Science: What is Normal Distribution? Introduction to the Normal Distribution Have you heard of the bell curve? It tends to be among the most discussed water-cooler topics among people. appeared first on Analytics Vidhya.
Introduction Statistical Analysis of text is one of the important steps of text pre-processing. The pyNLPL […] The post Textual Statistical Analysis Using pyNLPL (Pineapple) Library appeared first on Analytics Vidhya. It helps us understand our text data in a deep, mathematical way.
Introduction At the heart of data science lies statistics, which has existed for centuries yet remains fundamentally essential in today’s digital age. Because basic statistics concepts are the backbone of data analysis, enabling us to make sense of the vast amounts of data generated daily.
Introduction Statistical analysis means investigating trends, patterns, and relationships using quantitative data. To draw valid results, statistical analysis requires planning from the start of the research process. It is a crucial research tool used by scientists, governments, businesses, and other organizations.
Introduction “You can’t prove a hypothesis; you can only improve or disprove it.” – Christopher Monckton Every day we find ourselves testing new ideas, The post Statistics for Data Science: Introduction to t-test and its Different Types (with Implementation in R) appeared first on Analytics Vidhya.
Introduction What is one of the most important and core concepts of statistics that enables us to do predictive modeling, and yet it often. The post Statistics 101: Introduction to the Central Limit Theorem (with implementation in R) appeared first on Analytics Vidhya.
A key idea in data science and statistics is the Bernoulli distribution, named for the Swiss mathematician Jacob Bernoulli. It is crucial to probability theory and a foundational element for more intricate statistical models, ranging from machine learning algorithms to customer behaviour prediction.
The post Introduction to ANOVA for Statistics and Data Science (with COVID-19 Case Study using Python) appeared first on Analytics Vidhya. Introduction “A fact is a simple statement that everyone believes. It’s innocent, unless found guilty. A Hypothesis is a novel suggestion that no one.
While Pandas’ describe() function has been a go-to tool for many, its functionality is limited to numeric data and provides only basic statistics. Data summarization is an essential first step in any data analysis workflow.
Introduction Exploratory Data Analysis (EDA) is a process of describing the data by means of statistical and visualization techniques in order to bring important aspects of that data into focus for further analysis. Exploratory Data Analysis […] The post What is Exploratory Data Analysis (EDA) and How Does it Work?
The normal distribution, also known as the Gaussian distribution, is one of the most widely used probability distributions in statistics and machine learning. Understanding its core properties, mean and variance, is important for interpreting data and modelling real-world phenomena.
Source: [link] Data are details, facts, statistics, or pieces of information, typically numerical. Source: [link] What is DATA by Definition? Data are a set of values of qualitative or quantitative variables about one or more persons or objects. While running a huge […].
In our cutthroat digital age, the importance of setting the right data analysis questions can define the overall success of a business. That being said, it seems like we’re in the midst of a data analysis crisis. That being said, it seems like we’re in the midst of a data analysis crisis. Data Is Only As Good As The Questions You Ask.
” The only way to test the hypothesis is to look for all the information that disagrees with it – Karl Popper“ Hypothesis Testing comes under a broader subject of Inferential Statistics where we use data samples to draw inferences on the population […].
Statistics plays an important role in the domain of Data Science. One of the popular statistical processes is Hypothesis Testing having vast usability, not […]. This article was published as a part of the Data Science Blogathon.
With its use of statistical […] The post How to Perform Data Preprocessing Using Cleanlab? Data preprocessing using Cleanlab provides an efficient solution, leveraging its Python package to implement confident learning algorithms.
ChatGPT, or something built on ChatGPT, or something that’s like ChatGPT, has been in the news almost constantly since ChatGPT was opened to the public in November 2022. What is it, how does it work, what can it do, and what are the risks of using it? A quick scan of the web will show you lots of things that ChatGPT can do. It’s much more.
Introduction A fundamental component of statistical technique, regression analysis is essential for examining and measuring connections between variables. Its uses are numerous and diverse, from forecasting financial trends to evaluating medical results.
I use the term external data to include any information about the world outside an organization (including economic and market statistics), competitors (such as pricing and locations) and customers. Enterprises do not operate in a vacuum, and things happening outside an organizations walls directly impact performance.
Introduction A language model in NLP is a probabilistic statistical model that determines the probability of a given sequence of words occurring in a sentence based on the previous words. This article was published as a part of the Data Science Blogathon. It helps to predict which word is more likely to appear next in the […].
Introduction The log-normal distribution is a fascinating statistical concept commonly used to model data that exhibit right-skewed behavior. This distribution has wide-ranging applications in various fields, such as biology, finance, and engineering.
It combines concepts and methods from the domains of mathematics, statistics, AI, and computer engineering. Introduction Data science is the study of data to gain important business insights.
Usually, some data has to be left out of the training process so that only the most relevant data and features are used. This […]. The post Principal Component Analysis & its Implementions appeared first on Analytics Vidhya.
Overview Sampling is a popular statistical concept – learn how it works in this article We will also talk about eight different types of. The post A Data Scientist’s Guide to 8 Types of Sampling Techniques appeared first on Analytics Vidhya.
Introduction Bayesian Networks or statistics form an integral part of many statistical learning approaches. It involves using new evidence to modify the prior probabilities of an event. It uses conditional probabilities to improve the prior probabilities, which results in posterior probabilities.
Given the escalation of the use of statistical data in organizations […] The post How to Become a Statistician? Introduction Think of it as the ability to be the person that gets to make informed decisions for you and for your company in the fields such as healthcare or finance or the sports industry among others.
Identifying and interpreting it is essential in many fields, including statistics, computer science, psychology, and marketing. Introduction Nominal data is one of the most fundamental types of data in data analysis. This article examines nominal data’s characteristics, applications, and differences from other data types.
It is a statistical classification algorithm. This article was published as a part of the Data Science Blogathon. AdaBoost stands for Adaptive Boosting. It is an algorithm that forms a committee of weak classifiers. It boosts the performance of machine learning algorithms.
So data science is a vast and a type of mixed field of statistical analysis, computer science, and domain expertise. Introduction Mathematics is a way of uncovering possible insights or information from data as done in the field of Data Science.
It involves collecting, processing, and analysing data using math, statistics, specialized programming, artificial intelligence, machine learning, and more. Source: istockphoto Introduction Data Science is a fast-booming domain that has seen exponential growth in recent years.
A Latent Space Theory for Emergent Abilities in Large Language Models ” by Hui Jiang presents a statistical explanation for emergent LLM abilities, exploring a relationship between ambiguity in a language versus the scale of models and their training data. “ Split each document into chunks. Do LLMs Really Adapt to Domains?
According to the Bureau of Labor Statistics (BLS), the employment of research analysts, including data analysts, is projected to increase by 23% from 2021 to 2031. This significant growth in data analysis careers presents promising prospects for aspiring candidates. It profoundly impacts the services and products provided to the public.
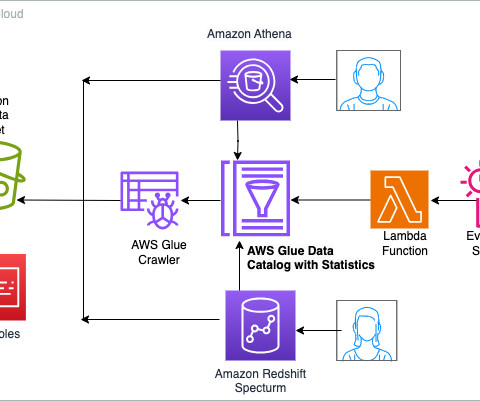
Today, we’re making available a new capability of AWS Glue Data Catalog that allows generating column-level statistics for AWS Glue tables. These statistics are now integrated with the cost-based optimizers (CBO) of Amazon Athena and Amazon Redshift Spectrum , resulting in improved query performance and potential cost savings.
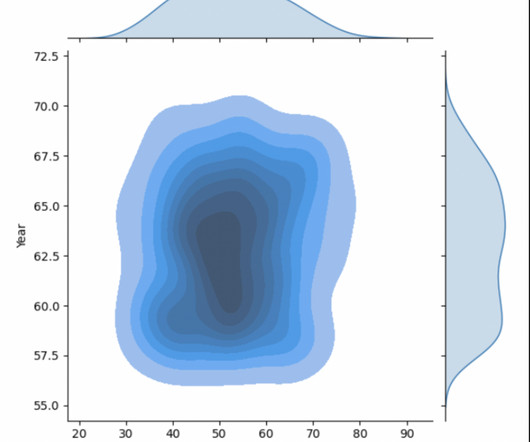
Introduction For creating eye-catching and educational statistics visuals, Seaborn provides a high-level interface. Seaborn makes it simple to build and modify line plots, which are helpful for displaying data trends over time.
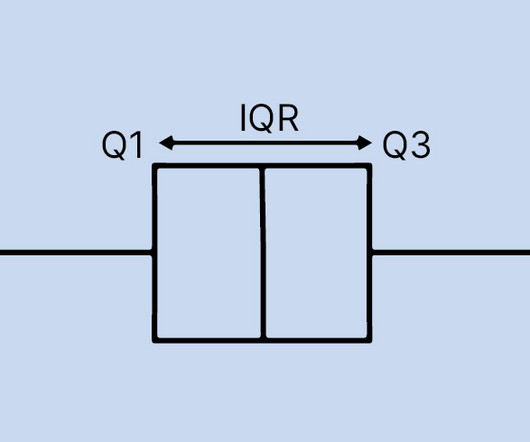
Introduction In the world of data analysis and statistics, visualizations play a crucial role in understanding the underlying patterns and outliers within datasets. One such powerful visualization tool is the boxplot, a box-and-whisker plot.
It covers examples such as drink sizes and professional ranks, applications in subjective evaluations like customer satisfaction surveys, appropriate statistical measures, and the qualitative nature of ordinal data. Understanding this data is […] The post Understanding and Using Ordinal Data appeared first on Analytics Vidhya.
We organize all of the trending information in your field so you don't have to. Join 42,000+ users and stay up to date on the latest articles your peers are reading.
You know about us, now we want to get to know you!
Let's personalize your content
Let's get even more personalized
We recognize your account from another site in our network, please click 'Send Email' below to continue with verifying your account and setting a password.


Let's personalize your content