This site uses cookies to improve your experience. To help us insure we adhere to various privacy regulations, please select your country/region of residence. If you do not select a country, we will assume you are from the United States. Select your Cookie Settings or view our Privacy Policy and Terms of Use.
Cookie Settings
Cookies and similar technologies are used on this website for proper function of the website, for tracking performance analytics and for marketing purposes. We and some of our third-party providers may use cookie data for various purposes. Please review the cookie settings below and choose your preference.
Used for the proper function of the website
Used for monitoring website traffic and interactions
Cookie Settings
Cookies and similar technologies are used on this website for proper function of the website, for tracking performance analytics and for marketing purposes. We and some of our third-party providers may use cookie data for various purposes. Please review the cookie settings below and choose your preference.
Strictly Necessary: Used for the proper function of the website
Performance/Analytics: Used for monitoring website traffic and interactions
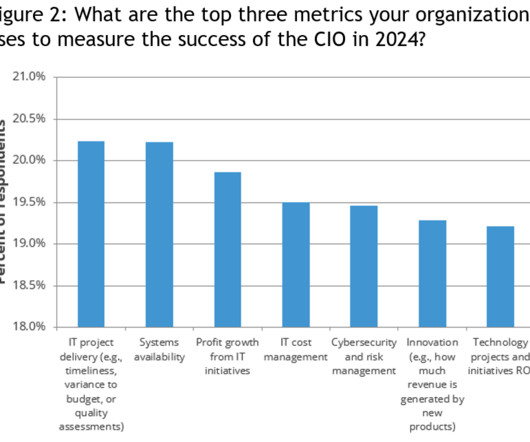
As digital transformation becomes a critical driver of business success, many organizations still measure CIO performance based on traditional IT values rather than transformative outcomes. This creates a disconnect between the strategic role that CIOs are increasingly expected to play and how their success is measured.
Regardless of where organizations are in their digital transformation, CIOs must provide their board of directors, executive committees, and employees definitions of successful outcomes and measurablekeyperformanceindicators (KPIs). He suggests, “Choose what you measure carefully to achieve the desired results.
Data dashboards provide a centralized, interactive means of monitoring, measuring, analyzing, and extracting a wealth of business insights from relevant datasets in several key areas while displaying aggregated information in a way that is both intuitive and visual. Learn all about data dashboards with our executive bite-sized summary!
Data quality must be embedded into how data is structured, governed, measured and operationalized. Implementing Service Level Agreements (SLAs) for data quality and availability sets measurable standards, promoting responsibility and trust in data assets. Key principles of agile data SWAT teams Co-locate with business units.
4) How to Select Your KPIs 5) Avoid These KPI Mistakes 6) How To Choose A KPI Management Solution 7) KPI Management Examples Fact: 100% of statistics strategically placed at the top of blog posts are a direct result of people studying the dynamics of KeyPerformanceIndicators, or KPIs. What happens next?
The problem: the complexity of interpreting the laws and deriving the necessary measures and requirements from them represents a significant hurdle for many companies. Design reporting and monitoring In this step, essential keyperformanceindicators (KPIs) should be defined for later reporting.
But first, let’s begin with a general understanding of key metrics and their usage in business. What gets measured gets done.” – Peter Drucker. Business metrics are used to evaluate performance, compare results, and track relevant data to improve business outcomes. Who will measure it?
That’s why it’s critical to monitor and optimize relevant supply chain metrics. While there are numerous KPI examples you can select for your assessment and optimization, we have focused on a list that will enable you to identify potential bottlenecks and ensure sustainable development. Freight Bill Accuracy.
A Warehouse KPI is a measurement that helps warehousing managers to track the performance of their inventory management, order fulfillment, picking and packing, transportation, and overall operations. Therefore, it is very important to pick your indicators based on your actual needs. Let’s dive in with the definition.
I recently had an opportunity to recommend to a group of CEOs everything they should measure for everything they should do with digital. One good way to accomplish that is to ensure you have an optimal org design , and that your Digital Marketing and Measurement Model exemplifies this balance. Now measure like crazy!
Operational optimization and forecasting. Every serious business uses keyperformanceindicators to measure and evaluate success. Cost optimization. Another important factor to consider is cost optimization. Operational optimization and forecasting. Cost optimization.
Depending on the reward structure within an organization, some parties might be less likely to challenge models that help elevate their own specific keyperformanceindicators (KPIs). Risk-control staff take care of risk measurement, limits, monitoring, and independent validation. Governance, policies, controls.
Through dashboards, organizations can quickly identify current and historical performance. By integrating these keyperformanceindicators (KPIs) and goals into their dashboards, companies can proactively identify issues, minimize costs and strive to exceed performance expectations. b) CMO strategic dashboard.
Sometimes, we escape the clutches of this sub optimal existence and do pick good metrics or engage in simple A/B testing. First, you figure out what you want to improve; then you create an experiment; then you run the experiment; then you measure the results and decide what to do. Measure and decide what to do.
Why not just measure Profit?" " That is right, we will measure it. The examples cover elements we optimize for in our acquisition ( what are we doing to attract traffic ), behavior ( what happens once they land on our website ) and outcomes ( did we end up making money, were the customers satisfied ) strategies.
In today’s business world, competition is fierce across all industries and sectors, which means that to survive and thrive, working with measurable online data analysis and performance metrics is essential. A helpdesk KPI (or service desk KPI) is a performance metric centered on your business’s customer service and support activities.
Data analytics make up the relevant keyperformanceindicators ( KPIs ) or metrics necessary for a business to create various sales and marketing strategies. With it, you can measure your keyperformanceindicators quickly and more objectively than traditional methods. Holistic Customer Experience.
Armed with powerful visualizations and real-time data, modern weekly summary reports enable businesses to closely monitor their performance and the progress of their strategies to extract relevant insights and optimize their processes to ensure constant growth. Your Chance: Want to build great weekly status reports on your own?
To optimize cloud investments, C-level executives are increasingly adopting cloud financial operations (FinOps). In this article, I’ll explore common cloud optimization and FinOps challenges and strategies for overcoming them. Utilization and efficiency provide vital insights for understanding the business value of expenses incurred.
This platform will incorporate robust cataloging, making sure the data is easily searchable, and will enforce the necessary security and governance measures for selective sharing among business stakeholders, data engineers, analysts, security and governance officers. As stated earlier, the first step involves data ingestion.
A CEO dashboard is an interactive platform that visualizes data to empower business leaders to track, measure, analyze, and monitor business performance in a number of areas, enabling them to make data-driven decisions and see the big business picture. Let’s get started. What Is A CEO Dashboard? click to enlarge**.
In order to really ensure you are growing and making the most out of your data-driven efforts, it is necessary to implement measurable goals that will allow you to efficiently assess your strategic efforts. That said, there are various methods and tools businesses use to manage their data and optimize their performance.
However, if you want to enjoy optimal success, gaining a firm grasp of logical judgment and strategic thinking is essential – especially regarding dashboard design principles. Operational: A business intelligence tool that exists to monitor, measure and manage processes or operations with a shorter or more immediate time scale.
That’s why it is of utmost importance to start with utilizing the right keyperformanceindicators – there are numerous KPI examples that can make or break the quality process of data management. Building advanced analytics models that can optimize outcomes is one of the latest BI trends that will shape the future of BI.
It is a bit hard to believe that it has taken a year to talk about measuring effectiveness of individual pages on a website. But I think the time is right to focus on metrics, KeyPerformanceIndicators and tips on how to measure effectiveness of individual pages. 2: Compute Your Cliff – Only Then Jump. #
Almost every business tracks keyperformanceindicators (KPIs) in specific areas to gauge their success. Measuring KPIs allows for improved goal setting by providing quantifiable evidence of the company’s performance. Big Data Makes it Easier to Track KPIs in Shipping Logistics.
By implementing the right reporting tools and understanding how to analyze as well as to measure your data accurately, you will be able to make the kind of data driven decisions that will drive your business forward. Qualitative data analysis is based on observation rather than measurement. Of course, this sounds incredible in theory.
I am going to break one of my unspoken cardinal rules: Only write about real problems and measurement that is actually possible in the real world. I am going to define a way for you to think about measuring social media, and you can't actually easily measure what I am going to recommend. So why not measure that?
Why just measure conversions as one purchase or conversions just as a submission of a lead or opening of an account on facebook / twitter / what ever? Why not measure Visitor behavior after that first purchase / lead / membership sign up (or the first super poke)? Yet it is likely that you are measuring incomplete success.
An Operations KeyPerformanceIndicator (KPI) or metric is a discrete measurement that a company uses to monitor and evaluate the efficiency of its day-to-day operations. Leading companies make use of KPIs and KPI dashboards to measure their efficiency in real time. What is an Operations KPI?
The importance of this finance dashboard lays within the fact that every finance manager can easily track and measure the whole financial overview of a specific company while gaining insights into the most valuable KPIs and metrics. These findings need to be balanced and justifiable – what significance they have to the purpose of the report.
But if you find a development opportunity, and see that your business performance can be significantly improved, then a KPI dashboard software could be a smart investment to monitor your keyperformanceindicators and provide a transparent overview of your company’s data. Did the best according to what? Who are they?
To not have it as an active part of your marketing portfolio is sub-optimal. You just have to have the right mental model (see Seth Godin above) and you have to… wait for it… wait for it… measure everything you do! For everything you do it is important to measure your effectiveness of all three phases of your effort: Acquisition.
In essence, a project management dashboard is a data-driven platform that displays metrics, stats, and insights that are specific to a particular project or strategy by presenting a tailored mix of keyperformanceindicators (KPIs) in one central location. Another key attribute of project-based software is portability.
This includes defining the main stakeholders, assessing the situation, defining the goals, and finding the KPIs that will measure your efforts to achieve these goals. Collect and prioritize pain points and keyperformanceindicators (KPIs) across the organization. Identify keyperformanceindicators (KPIs).
And apps related to measuring quality, coaching, training and other in-center actions. For example, chatbots and virtual assistants that raise the containment rate affect the content and quantity of interactions that ultimately reach agents, changing the nature of the skills they need and the keyperformanceindicators that measure success.
They should get a handful of numbers/charts (ideally identified upfront by the Digital Marketing and Measurement Model – DMMM) and they should get your brain in a box. Here's a CDP for our Real Time Site Optimization Team… Their sleeves are rolled up, they are on the stand-by to take real time action.
Management thinker Peter Drucker once stated, “if you can’t measure it, you can’t improve it” – and he couldn’t be more right. Using the right marketing KPIs (keyperformanceindicators) is a good start – what is now left is finding a way to organize it all in a way that makes sense and brings value.
Because things are changing and becoming more competitive in every sector of business, the benefits of business intelligence and proper use of data analytics are key to outperforming the competition. Consumers have grown more and more immune to ads that aren’t targeted directly at them. Let’s see it with a real-world example. The results?
An engineering KeyPerformanceIndicator (KPI) or metric is a clearly defined quantifiable measure that an engineering firm uses to gauge its success over time. With engineering being a very broad field, KPIs are employed in a variety of ways, ranging from company-wide analysis to project specific performance metrics.
To derive data management’s ROI, your organization can use your relevant keyperformanceindicators (KPIs). This includes metrics beyond traditional financial and operational measures, including customer retention and advocacy, employee satisfaction and productivity, societal and environmental factors, and ethical outcomes.
Incremental Sales Calculation As mentioned, incremental sales are used by businesses as a keyperformanceindicator to measure the financial success of their promotional efforts. But how do you calculate the impact of your promotional strategies? Keep reading to find out!
In a data-driven age, modern organizations need access to advanced data analytics solutions to help them improve the business in a wealth of key areas—Salesforce is one of those solutions. Keyperformanceindicators are an integral part of the report-building process. 4) Track, measure, refine, repeat.
Scorecards use excellent visual effects to present keyperformanceindicators (KPIs), which can help companies compare predicted targets with actual conditions to measure and manage business performance. This article aims to provide a reference for the choice of enterprises. business intelligence. Assist companies.
We organize all of the trending information in your field so you don't have to. Join 42,000+ users and stay up to date on the latest articles your peers are reading.
You know about us, now we want to get to know you!
Let's personalize your content
Let's get even more personalized
We recognize your account from another site in our network, please click 'Send Email' below to continue with verifying your account and setting a password.
Let's personalize your content