This site uses cookies to improve your experience. To help us insure we adhere to various privacy regulations, please select your country/region of residence. If you do not select a country, we will assume you are from the United States. Select your Cookie Settings or view our Privacy Policy and Terms of Use.
Cookie Settings
Cookies and similar technologies are used on this website for proper function of the website, for tracking performance analytics and for marketing purposes. We and some of our third-party providers may use cookie data for various purposes. Please review the cookie settings below and choose your preference.
Used for the proper function of the website
Used for monitoring website traffic and interactions
Cookie Settings
Cookies and similar technologies are used on this website for proper function of the website, for tracking performance analytics and for marketing purposes. We and some of our third-party providers may use cookie data for various purposes. Please review the cookie settings below and choose your preference.
Strictly Necessary: Used for the proper function of the website
Performance/Analytics: Used for monitoring website traffic and interactions
Not only are you responsible for the ongoing financial strategy of your organization, but you’re probably expected to provide timely, accurate reports to a variety of stakeholders. CFO reports supercharge your financial initiatives. Benefit from great CFO dashboards & reports! What Is A CFO Report?
To put the power of CRM software (or customer relationship management dashboard software) into a living, breathing, real-world perspective, we’ll explore CRM dashboards in more detail, starting with basic definitions of such dashboards and reports while considering how you can use CRM dashboard software to your business-boosting advantage.
Management reporting is a source of business intelligence that helps business leaders make more accurate, data-driven decisions. But, these reports are only as useful as the work that goes into preparing and presenting them. By the end of this article, making stunning and useful managerial reports will be second nature to you.
Whether you manage a big or small company, business reports must be incorporated to establish goals, track operations, and strategy, to get an in-depth view of the overall company state. And business report templates are the best help for that. Your Chance: Want to test professional business reporting software?
Big data plays a crucial role in online data analysis , business information, and intelligent reporting. That’s where business intelligence reporting comes into play – and, indeed, is proving pivotal in empowering organizations to collect data effectively and transform insight into action. What Is BI Reporting?
Moreover, within just five years, the number of smart connected devices in the world will amount to more than 22 billion – all of which will produce colossal sets of collectible, curatable, and analyzable data, claimed IoT Analytics in their industry report. One of the most effective means of doing this is by utilizing KPI reporting tools.
As a business, you need the reliability of frequent financial reports to gain a better grasp of your financial status, both current and future. A robust finance report communicates crucial financial information that covers a specified period through daily, weekly, and monthly financial reports. What Is A Finance Report?
1) What Is A Weekly Report? 2) Why Are Weekly Progress Reports Important? 3) Weekly Report Templates & Examples. 4) Top Elements Of A Weekly PerformanceReport. This is where interactive weekly reports come into the picture. Your Chance: Want to build great weekly status reports on your own?
Whatever your niche or industry, working with dynamic keyperformanceindicators (KPIs) will empower you to track and improve your performance in a number of key areas, accelerating your commercial success in the process. We offer a 14 day free trial. Benefit from a great tracking system today!
As in many other industries, the information technology sector faces the age-old issue of producing IT reports that boost success by helping to maximize value from a tidal wave of digital data. Get our summary to learn the key elements and benefits of IT reporting! What Are IT Reports? Why Do You Need An IT Report?
In essence, in this post, we will explain all the details needed for dashboard reporting and creation, compare interactive vs. static reporting, and provide tips and tricks to make your business perform even better. Interactive Dashboards vs. Static Reporting. With modern reporting tools , there is no need to do so.
By gaining the ability to gather, organize and analyze the metrics that are most important to your organization, you stand to make your business empire more intelligent than ever before – and executive reporting and business dashboards will help you do just that. Exclusive Bonus Content: Executive Dashboards & Reports: A Summary.
With so many digital insights available in our hyper-connected age of information, a professional report tool is the most effective means of collecting, curating, organizing, and analyzing your most valuable business data. Exclusive Bonus Content: Get our free summary to create better reports! What Is Static Reporting?
It provides a brief snapshot of the entire business. digital performance. It also handy explanations of the metrics, with key context where necessary. Yes, it does summarize data from many reports into one. The so what based on data you've summarized and snapshotted. Comprehensive, yet not too much.
At work, we often hear others talking about reports. But what does reporting mean exactly? There are multiple types of reporting. In this article, I would like to introduce what reporting is and give you some examples to clarify the key concepts. What is Reporting? All reports address some specific goal.
Working with service desk metrics and KPI reports will help you make the improvements you need for continual growth and success. Like helpdesk KPIs, service desk metrics and keyperformanceindicators are designed to assist in the continued growth, success, and improvement of your business’s consumer-facing efforts.
Let’s examine how you can do so with the following sales KPIs, created for a comprehensive sales report. Setting goals and then keeping track of whether those goals are being met is a hallmark of high-performing teams. Number 6 on our list is a sales graph example that offers a detailed snapshot of sales conversion rates.
Dashboard reporting refers to putting the relevant business metrics and KPIs in one interface, presenting them visually, dynamic, and in real-time, in the dashboard formats. With the advent of modern dashboard reporting tools, you can conveniently visualize your data into dashboards and reports and extract insightful information from it.
A financial KeyPerformanceIndicator (KPI) or metric is a quantifiable measure that a company uses to gauge its financial performance over time. However, not all key financial performanceindicators are directly shown in the standard reporting and require some calculating.
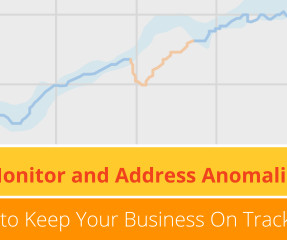
Smarten announces the launch of SnapShot Anomaly Monitoring Alerts for Smarten Augmented Analytics. SnapShot Monitoring provides powerful data analytical features that reveal trends and anomalies and allow the enterprise to map targets and adapt to changing markets with clear, prescribed actions for continuous improvement.
One of the most effective ways of transforming quantitative data into a results-driven narrative is by working with keyperformanceindicators (KPIs). A valued fulfillment-based KPI across industries, this dynamic mix of graphs offers a panoramic snapshot of supplier compliance rates over a particular time frame.
By harnessing the insights, information, and metrics that are most valuable to key aspects of your business and understanding how to take meaningful actions from your data, you will ensure your business remains robust, resilient, and competitive. Intelligent reporting. Instant insights. Progress monitoring. Predicting the future.
One of the most superbly helpful supply chain KPI available today focuses on logistics KPIs and helps a business understand the number of times its entire inventory has been sold over a certain time frame: an incredible indicator of efficient production planning, process strategy, fulfillment abilities, and marketing and sales management.
A manufacturing KeyPerformanceIndicator (KPI) or metric is a well defined and quantifiable measure that the manufacturing industry uses to gauge its performance over time. Reporting your data is just as important as collecting it. Different manufacturing KPIs will have different reporting frequencies.
KeyPerformanceIndicators (KPIs) serve as vital metrics that help measure progress towards business goals. To effectively monitor and analyze these metrics, businesses utilize KPI reports. These reports assist companies in achieving their business objectives by identifying strengths, weaknesses, and trends.
There are three elements to our "big data" efforts, or unhyped normal data efforts: Data Collection, Data Reporting, and Data Analysis. After all you spent so much time on collection, reporting and analysis. Then invested all that time and energy in reporting it. It is hard to do. Don't stop there.
Making petabytes of data accessible for ad-hoc reports became a challenge as query time increased and costs skyrocketed along with growing compute resource requirements. Expire snapshots Each write to an Iceberg table creates a new snapshot , or version, of a table. SparkActions.get().expireSnapshots(iceTable).expireOlderThan(TimeUnit.DAYS.toMillis(7)).execute()
In this article, we’ll look at how DNV took intelligence from its massive datasets and put the right bits of information into its platforms in the right way (not simply embedding reports and dashboards) to drive impact for its users. Understanding the difference: Reports vs. analytic application.
One invaluable tool for gaining these insights is the performancereport. What is A PerformanceReport? A performancereport serves as a valuable instrument for businesses, providing a digital compilation of analysis, projections, revenue, and budget to provide an overview of their performance.
Enterprise Performance Management (EPM) gives C-level executives and others throughout your organization a vivid, up-to-the-minute picture of key business metrics. The extent of time and effort it takes to develop the dashboards and reports that will best serve your organization varies widely among EPM tools.
A business dashboard offers at-a-glance insights based on keyperformanceindicators (KPIs) and is an intuitive and visually pleasing way to consume data. For any organization, regardless of sector or industry, that needs a stable snapshot of its ongoing financial health, this particular dashboard makes a powerful tool.
Augmented Analytics with anomaly monitoring and alerts allows you to establish keyperformanceindicators (KPIs) and to set up alerts and thresholds so that you will know as soon as something important occurs. Discover the power of Smarten SnapShot Anomaly Monitoring And Alerts , and Augmented Analytics Products.
Solution overview In this post, we walk through a call center analytics solution that provides insights into the call center’s performance in near-real time through metrics that determine agent efficiency in handling calls in the queue. Agent states are reported in agent-state events.
Success criteria alignment by all stakeholders (producers, consumers, operators, auditors) is key for successful transition to a new Amazon Redshift modern data architecture. The success criteria are the keyperformanceindicators (KPIs) for each component of the data workflow.
A financial dashboard, one of the most important types of data dashboards , functions as a business intelligence tool that enables finance and accounting teams to visually represent, monitor, and present financial keyperformanceindicators (KPIs).
That means there is a huge opportunity for sales departments to use analyzed data to improve and streamline performance — especially in the sales arena, where keyperformanceindicators (KPIs) like cost per lead, customer acquisition cost, and year-over-year growth rule the lives of front-line Account Development Reps (ADRs) and VPs alike.
SLA components SLAs include an overview of the parties involved, services to be provided, stakeholder role breakdowns, performance monitoring and reporting requirements. Crucially, they define how performance will be measured. The key is monitoring the right metrics. What is a KPI in an SLA?
They allow everyone to use the same data, making reports a single source of truth. Reports connected to live data sources with clean and validated sales data allow organizations to be more agile, pivot quickly, and effectively work opportunities to hit quotas. Once the dashboard and reports are finished, share them with your team.
Using anomaly alerts and monitoring tools, business team members can quickly establish keyperformanceindicators (KPIs) and personalized alerts and reports to monitor and measure results with powerful, clear, concise results that help users to understand and manage the variables that impact their targets and their results.’
Building an effective report following some dashboard design principles is crucial to a comprehensive BI process. A cool dashboard is not only visually pleasing, but it also offers a level of logical organization that makes it easier to drill down into specific keyperformanceindicators (KPIs), trends, or patterns.
Dashboard storytelling is the process of presenting data in effective visualizations that depict the whole narrative of keyperformanceindicators, business strategies and processes in the form of an interactive dashboard on a single screen, and in real-time. .” – Margaret Atwood. What Is Dashboard Storytelling?
That might be a sales performance dashboard for your Chief Revenue Officer, a snapshot of “days sales outstanding” (DSO) for the A/R collections team, or an item sales trend analysis for product management. Creating reports from the ground up can be a lengthy, labor-intensive process that’s usually outsourced to the IT department.
We organize all of the trending information in your field so you don't have to. Join 42,000+ users and stay up to date on the latest articles your peers are reading.
You know about us, now we want to get to know you!
Let's personalize your content
Let's get even more personalized
We recognize your account from another site in our network, please click 'Send Email' below to continue with verifying your account and setting a password.


Let's personalize your content