This site uses cookies to improve your experience. To help us insure we adhere to various privacy regulations, please select your country/region of residence. If you do not select a country, we will assume you are from the United States. Select your Cookie Settings or view our Privacy Policy and Terms of Use.
Cookie Settings
Cookies and similar technologies are used on this website for proper function of the website, for tracking performance analytics and for marketing purposes. We and some of our third-party providers may use cookie data for various purposes. Please review the cookie settings below and choose your preference.
Used for the proper function of the website
Used for monitoring website traffic and interactions
Cookie Settings
Cookies and similar technologies are used on this website for proper function of the website, for tracking performance analytics and for marketing purposes. We and some of our third-party providers may use cookie data for various purposes. Please review the cookie settings below and choose your preference.
Strictly Necessary: Used for the proper function of the website
Performance/Analytics: Used for monitoring website traffic and interactions
Fragmented systems, inconsistent definitions, legacy infrastructure and manual workarounds introduce critical risks. The decisions you make, the strategies you implement and the growth of your organizations are all at risk if data quality is not addressed urgently. Manual entries also introduce significant risks.
Design reporting and monitoring In this step, essential keyperformanceindicators (KPIs) should be defined for later reporting. Only in this way can risks be minimized and the highest compliance standards guaranteed. Those KPIs should be aligned with the compliance objectives and serve as a basis for later reporting.
After the 2008 financial crisis, the Federal Reserve issued a new set of guidelines governing models— SR 11-7 : Guidance on Model Risk Management. In the remainder of this post, we'll list the key areas and recommendations covered in SR 11-7, and explain how they are relevant to recent developments in machine learning.
Through dashboards, organizations can quickly identify current and historical performance. By integrating these keyperformanceindicators (KPIs) and goals into their dashboards, companies can proactively identify issues, minimize costs and strive to exceed performance expectations. b) CMO strategic dashboard.
Risk assessment & opportunity: With business reports samples, you can increase the understanding of risks and opportunities within your company. You can find multiple keyperformanceindicator examples in different industries, which should be considered when creating that kind of report.
The purpose is not to track every statistic possible, as you risk being drowned in data and losing focus. Select the right KPIs: When it comes to creating an effective IT management report, selecting the best keyperformanceindicators for the job is essential. Here are the best practices to consider: 1.
These changes can expose businesses to risks and vulnerabilities such as security breaches, data privacy issues and harm to the companys reputation. It also includes managing the risks, quality and accountability of AI systems and their outcomes. AI governance is critical and should never be just a regulatory requirement.
That’s why it is of utmost importance to start with utilizing the right keyperformanceindicators – there are numerous KPI examples that can make or break the quality process of data management. Artificial intelligence (AI) is the science aiming to make machines execute what is usually done by complex human intelligence.
Combining Agile and DevOps with elements such as cloud, testing, security, risk management and compliance creates a modernized technology delivery approach that can help an organization achieve greater speed, reduced risk, and enhanced quality and experience. All hands on deck .
To derive data management’s ROI, your organization can use your relevant keyperformanceindicators (KPIs). Reduced risk: Effective data management can help businesses mitigate risks, such as data breaches, compliance violations, and reputational damage.
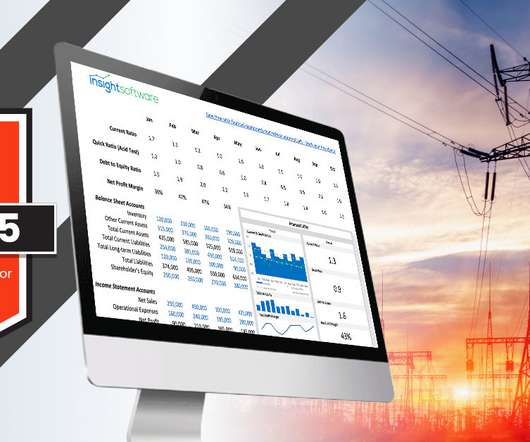
Keyperformanceindicators have never been more important for those in the utilities industry. Utility companies will need to report and monitor their KPIs obsessively to understand how these new approaches to energy are positively and negatively affecting their financial performance. 1) Liquidity.
Improved risk management: Another great benefit from implementing a strategy for BI is risk management. Collect and prioritize pain points and keyperformanceindicators (KPIs) across the organization. Identify keyperformanceindicators (KPIs). Then move past the executive team.
Keyperformanceindicators (KPIs) can serve as excellent measuring sticks that guide your progress and allow you to define and evaluate success. This is an especially important risk to acknowledge when presenting or interpreting data in ways that can potentially skew it. For example: Fixation on KPIs.
Unfortunately, there are often many weak links in the data security infrastructure, which can increase the risks of data breaches. One issue that they need to take into consideration is the importance of third-party data security risks caused by improper vendor security. These steps can help reduce the risks of data breaches.
Many of these tools also include customizable dashboards that can show keyperformanceindicators, strategic alignment, risk assessments, and progress on initiatives. Other organizations choose to integrate modeling tools that work well with their chosen framework, like ArchiMate or UML.
Yet given this era of digital transformation and fierce competition, understanding what data you have, where it came from, how it’s changed since creation or acquisition, and whether it poses any risks is paramount to optimizing its value. The risks of ignoring end-to-end data lineage are just too great. Who are the data owners?
Data Security & Risk Management. For example, an enterprise should start by developing a target operating model, which includes: Keyperformanceindicators (including goals, performance and benefits realization). Digital Transformation. Compliance/Legislation. Innovation Management. Artificial Intelligence.
As a result of the resolution of risks and the creation of hypotheses, data analysis assists businesses in generating sound business choices. Not only will it aid in evaluation and future forecasting, but it also enables us to make conclusions from previous occurrences, which is very useful in many situations.
In practice, this may involve implementing a change tracking system that captures all change requests and their associated details, such as the reason for the change, potential risks, and expected outcomes. Use metrics and keyperformanceindicators (KPIs) to assess the effectiveness of your change management processes.
Furthermore, the PMO serves as a centralized deposit of project-related information, such as status reports, identified risks and project interdependencies. According to Sargeant, companies in highly regulated industries, as well as organizations where projects present high levels of risk, often opt to implement a controlling PMO.
It is fundamental for AI and essential for reducing cybersecurity risks or streamlining cloud migration processes, among other things. Additionally, CIOs indicate that the lack of alignment between IT and the business is their third biggest challenge within their organization (IDCs CIO Sentiment Survey 2024, n = 395 ).
If you’re not using BI to your advantage, you risk the following for your business: Missing strategic growth opportunities Failing to take advantage of cost savings Falling down on customer satisfaction Losing your competitive edge …and more. They will also require different information to improve their work. Then examine what isn’t working.
The more problems that are identified and addressed, the lower the cumulative risk of fire involving targeted properties. The right kind of data can provide the direction responsible persons need when conducting fire risk assessments. Data analytics is really all about keyperformanceindicators.
Regardless of where organizations are in their digital transformation, CIOs must provide their board of directors, executive committees, and employees definitions of successful outcomes and measurable keyperformanceindicators (KPIs).
Topping the list of executive priorities for 2023—a year heralded by escalating economic woes and climate risks—is the need for data driven insights to propel efficiency, resiliency, and other key initiatives. Many companies have been experimenting with advanced analytics and artificial intelligence (AI) to fill this need.
A Warehouse KPI is a measurement that helps warehousing managers to track the performance of their inventory management, order fulfillment, picking and packing, transportation, and overall operations. It allows for informed decision-making and efficient risk mitigation. We will dive deeper into this point later in the post.
When these two elements are in harmony, there are fewer delays and less risk of data corruption. And no matter how articulate your goals and objectives are on the front end, you need the appropriate keyperformanceindicators (KPIs) on the back end to ensure results are analyzed in an objective fashion.
Data-savvy marketers have access to valuable insights into their customers, performance, and opportunities for improvement. Marketing departments that don’t embrace analytics risk being outpaced by competitors and consumer expectations. A recent survey found that 73% of consumers expect marketers to anticipate their needs.
AI/ML derives insights, such as capacity is reaching full, performance will top out soon, and latency anomalies that are impacting your systems, virtual machines, and, therefore, applications. Observability can go further to tell you what will happen and what to do about it ahead of time.
Each phase intersects with any of 10 knowledge areas, which include: integration, scope, time, cost, quality, human resources, communication, risk procurement, and stakeholder management. Risk management: Perform qualitative and quantitative risk analysis, plan risk mitigation strategies.
The CEO also makes decisions based on performance and growth statistics. An understanding of the data’s origins and history helps answer questions about the origin of data in a KeyPerformanceIndicator (KPI) reports, including: How the report tables and columns are defined in the metadata? Who are the data owners?
A financial KeyPerformanceIndicator (KPI) or metric is a quantifiable measure that a company uses to gauge its financial performance over time. This keyperformanceindicator is often used when analyzing the profitability of a potential project or investment. What is a Financial KPI?
That way, your feedback cycle will be much shorter, workflow more effective, and risks minimized. Evaluate your keyperformanceindicators. Regularly turning to KPIs in an agile environment is necessary in order to effectively evaluate progress, reflect on the performance, and improve discussions. Accept change.
Amazon Redshift features like streaming ingestion, Amazon Aurora zero-ETL integration , and data sharing with AWS Data Exchange enable near-real-time processing for trade reporting, risk management, and trade optimization. Apart from generating regulatory reports, these teams require visibility into the health of the reporting systems.
In order to gain such insights, though, you have to home in on the appropriate keyperformanceindicators (KPIs) and metrics. If you wait too long and have to go with a high percentage, you risk member anger. Here are a few that we recommend you try to keep tabs on: 1. Customer Acquisition Cost. Member Engagement.
To highlight the importance of business intelligence concepts in the modern age, here are the key benefits of embracing the power of BI: 1. The fact is, without business intelligence, you risk the very real possibility of drowning in data. They prevent you from drowning in data. quintillion bytes of data produced daily.
These partner scorecards should provide a more comprehensive overview and include overall performance information focused on keyperformanceindicators, including delivery, support, quality, partnership and innovation, governance and risk, and financials, he says.
By integrating financial planning with strategic and operational planning, organizations can evaluate financial profitability, identify potential gaps or risks, and make necessary adjustments to achieve financial targets. Keyperformanceindicators (KPIs) are established to measure progress and enable proactive management.
Costs are one of the supply chain keyperformanceindicators that shows relevant costs that are associated with supply chain management. For example, if your transportation costs are high and you decide to push the speed and weight of trucks, you can risk accidents and potentially detrimental consequences for your business.
But there are also risks, including potential cost overruns, lack of commitment and availability of the consultant, communications issues, contract breaches, and lack of needed skills. It’s also important to have performance metrics in place. Once information is disseminated, its retrieval becomes an insurmountable challenge.”
The objectives were lofty: integrated, scalable, and replicable enterprise management; streamlined business processes; and visualized risk control, among other aims, all fully integrating finance, logistics, production, and sales.
With accounts payable, as with all complex, continual processes, that means tracking keyperformanceindicators (KPIs). Everything can get better, and with so much about the future of the economy looking uncertain or alarming, everything must. Invoice Exception Rate.
In addition to that, the risk assessment will not be carried out properly, and you won’t know what pitfalls lie ahead until you’re already knee-deep in the problem. A digital transformation project without clear goals or keyperformanceindicators is like catching the wrong bus.
We organize all of the trending information in your field so you don't have to. Join 42,000+ users and stay up to date on the latest articles your peers are reading.
You know about us, now we want to get to know you!
Let's personalize your content
Let's get even more personalized
We recognize your account from another site in our network, please click 'Send Email' below to continue with verifying your account and setting a password.


Let's personalize your content