This site uses cookies to improve your experience. To help us insure we adhere to various privacy regulations, please select your country/region of residence. If you do not select a country, we will assume you are from the United States. Select your Cookie Settings or view our Privacy Policy and Terms of Use.
Cookie Settings
Cookies and similar technologies are used on this website for proper function of the website, for tracking performance analytics and for marketing purposes. We and some of our third-party providers may use cookie data for various purposes. Please review the cookie settings below and choose your preference.
Used for the proper function of the website
Used for monitoring website traffic and interactions
Cookie Settings
Cookies and similar technologies are used on this website for proper function of the website, for tracking performance analytics and for marketing purposes. We and some of our third-party providers may use cookie data for various purposes. Please review the cookie settings below and choose your preference.
Strictly Necessary: Used for the proper function of the website
Performance/Analytics: Used for monitoring website traffic and interactions
These are the so-called supercomputers, led by a smart legion of researchers and practitioners in the fields of data-driven knowledgediscovery. Again, the overall aim is to extract knowledge from data and, through algorithms based on artificial intelligence, to assist medical professionals in routine diagnostics processes.
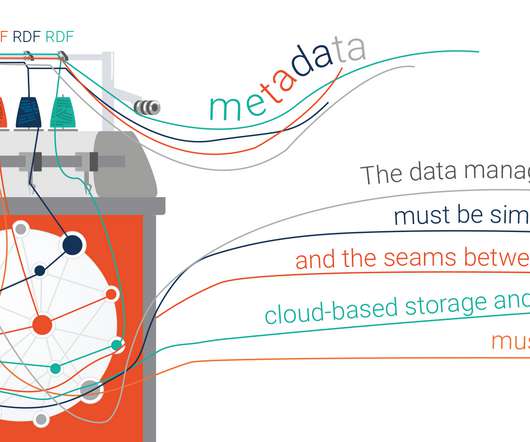
This means the creation of reusable data services, machine-readable semantic metadata and APIs that ensure the integration and orchestration of data across the organization and with third-party external data. Knowledge Graphs are the Warp and Weft of a Data Fabric. This provides a solid foundation for efficient data integration.
Beyond that, and without a way to visualize, connect, and utilize the data, it’s still just a bunch of random information. Without metadata management and other data-related operations with semantic technologies, organizations often struggle to connect data sets and achieve a unified view of their enterprise data.
These summaries, encapsulating key insights, are stored alongside the original content in the curated zone, enriching the organization’s data assets for further analysis, visualization, and informed decision-making. Explore the AWS Serverless Data Analytics Pipeline reference architecture and take advantage of the power of Amazon Bedrock.
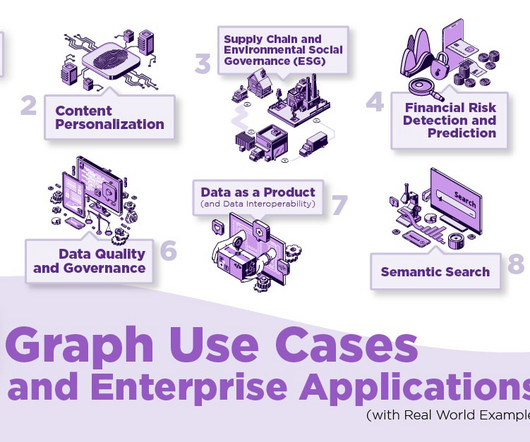
Graphs boost knowledgediscovery and efficient data-driven analytics to understand a company’s relationship with customers and personalize marketing, products, and services. million users. Yet, the biggest challenge for risk analysis continues to suffer from lack of a scalable way of understanding how data is interrelated.
As a result, contextualized information and graph technologies are gaining in popularity among analysts and businesses due to their ability to positively affect knowledgediscovery and decision-making processes. The goal should be to create value without really caring what is being used at the backend.
We organize all of the trending information in your field so you don't have to. Join 42,000+ users and stay up to date on the latest articles your peers are reading.
You know about us, now we want to get to know you!
Let's personalize your content
Let's get even more personalized
We recognize your account from another site in our network, please click 'Send Email' below to continue with verifying your account and setting a password.
Let's personalize your content