This site uses cookies to improve your experience. To help us insure we adhere to various privacy regulations, please select your country/region of residence. If you do not select a country, we will assume you are from the United States. Select your Cookie Settings or view our Privacy Policy and Terms of Use.
Cookie Settings
Cookies and similar technologies are used on this website for proper function of the website, for tracking performance analytics and for marketing purposes. We and some of our third-party providers may use cookie data for various purposes. Please review the cookie settings below and choose your preference.
Used for the proper function of the website
Used for monitoring website traffic and interactions
Cookie Settings
Cookies and similar technologies are used on this website for proper function of the website, for tracking performance analytics and for marketing purposes. We and some of our third-party providers may use cookie data for various purposes. Please review the cookie settings below and choose your preference.
Strictly Necessary: Used for the proper function of the website
Performance/Analytics: Used for monitoring website traffic and interactions
PubMiner AI key features PubMiner AI is aimed at biomedical researchers, pharmaceutical companies, Healthcare professionals, and data scientists looking to integrate AI with knowledge graphs for enhanced biomedical literature analysis and knowledgediscovery.
Social BI indicates the process of gathering, analyzing, publishing, and sharing data, reports, and information. One of the most imperative features of social BI is its ability to create self-served and user-generated analysis, coupled with the application of business user knowledge. What is Social Business Intelligence?
Data analysis is a type of knowledgediscovery that gains insights from data and drives business decisions. Professional data analysts must have a wealth of business knowledge in order to know from the data what has happened and what is about to happen. You can complete real-time report through simple drag and drop operations.
It is a process of using knowledgediscovery tools to mine previously unknown and potentially useful knowledge. It is an active method of automatic discovery. Data Visualization. Data visualization can reflect business operations intuitively. DASHBOARD REPORTING (by FineReport). REPORT FILLING.
Social BI indicates the process of gathering, analyzing, publishing, and sharing data, reports, and information. One of the most imperative features of social BI is its ability to create self-served and user-generated analysis, coupled with the application of business user knowledge. What is Social Business Intelligence?
These are the so-called supercomputers, led by a smart legion of researchers and practitioners in the fields of data-driven knowledgediscovery. Again, the overall aim is to extract knowledge from data and, through algorithms based on artificial intelligence, to assist medical professionals in routine diagnostics processes.
Organizations are collecting and storing vast amounts of structured and unstructured data like reports, whitepapers, and research documents. Through this seamless integration of serverless AWS services, enterprises can automate data enrichment, unlocking new possibilities for knowledge extraction from their valuable unstructured data.
Data mining is the process of discovering these patterns among the data and is therefore also known as KnowledgeDiscovery from Data (KDD). The patterns discovered after this step are interpreted using various visualization and reporting techniques and are made comprehensible for other team members to understand.
The drug under investigation is an anti-inflammatory agent, and the study looks at self-reported pain relief and plasma concentration over time. The study features 4 arms (including the placebo arm), using doses of 5mg, 20mg, and 80mg, administered at time 0, and tracks the self-reported pain relief and drug concentration at 0, 0.5,
This post looks at a specific clinical trial scoping example, powered by a knowledge graph that we have built for the EU funded project FROCKG , where both Ontotext and metaphacts are partners. often want to find information about a particular medical product, for example, if any serious adverse reactions have been reported for it.
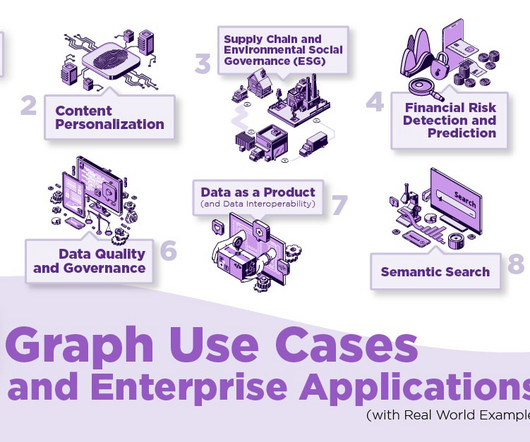
Graphs boost knowledgediscovery and efficient data-driven analytics to understand a company’s relationship with customers and personalize marketing, products, and services. Which financial institutions are behind on their risk reporting and filings this year? Linked Data, subscriptions, purchased datasets, etc.).
We organize all of the trending information in your field so you don't have to. Join 42,000+ users and stay up to date on the latest articles your peers are reading.
You know about us, now we want to get to know you!
Let's personalize your content
Let's get even more personalized
We recognize your account from another site in our network, please click 'Send Email' below to continue with verifying your account and setting a password.


Let's personalize your content