This site uses cookies to improve your experience. To help us insure we adhere to various privacy regulations, please select your country/region of residence. If you do not select a country, we will assume you are from the United States. Select your Cookie Settings or view our Privacy Policy and Terms of Use.
Cookie Settings
Cookies and similar technologies are used on this website for proper function of the website, for tracking performance analytics and for marketing purposes. We and some of our third-party providers may use cookie data for various purposes. Please review the cookie settings below and choose your preference.
Used for the proper function of the website
Used for monitoring website traffic and interactions
Cookie Settings
Cookies and similar technologies are used on this website for proper function of the website, for tracking performance analytics and for marketing purposes. We and some of our third-party providers may use cookie data for various purposes. Please review the cookie settings below and choose your preference.
Strictly Necessary: Used for the proper function of the website
Performance/Analytics: Used for monitoring website traffic and interactions
How does your organization define and display its metrics? I believe many organizations are not defining and displaying metrics in a way that benefits them most. If an organization goes through the trouble of measuring and reporting on a metric, the analysis ought to include all the information needed to evaluate that metric effectively.
That’s why it is of utmost importance to start with utilizing the right key performance indicators – there are numerous KPI examples that can make or break the quality process of data management. Tech giants use AI in many different ways that will alternate the machinelearning process and we should keep an eye on this process in 2020.
Shared data assets, such as product catalogs, fiscal calendar dimensions, and KPI definitions, require a common vocabulary to help avoid disputes during analysis. AI and machinelearning models. Establish a common vocabulary. Curate the data. Application programming interfaces.
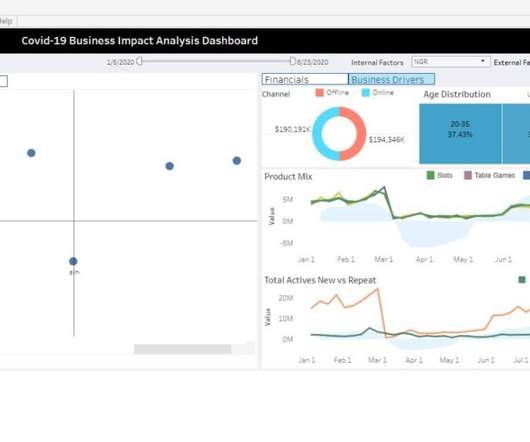
How to measure KPIs. KPIs are measured daily, monthly, quarterly, and yearly period of intervals. Output measured at various time intervals will provide a different perspective into the KPI which we are measuring. . Analyzing KPIs. The post KPI Dashboard during Covid and Beyond appeared first on BizAcuity Solutions Pvt.
How to measure KPIs. KPIs are measured daily, monthly, quarterly, and yearly period of intervals. Output measured at various time intervals will provide a different perspective into the KPI which we are measuring. . Analyzing KPIs. The post KPI Dashboard during Covid and Beyond appeared first on BizAcuity Solutions Pvt.
Thanks to the right KPI software , it is much easier to identify trends and setting goals that will ultimately increase productivity, drive growth, and boost profits. This might sound scary and daunting, but luckily, we live in a digital arena where you can utilize modern machinelearning features and let the software do the hard work.
Historically, business users have been presented with dashboards that describe the current state of a KPI, i.e. Net Profitability, Customer Retention, and more. What happens next is a treasure hunt in identifying the drivers of the KPI’s behavior. Join us to find out how Birst is reshaping the landscape of BI and analytics once again.
The culture transformation and evolutions in digital core competencies that CIOs target as their new collaborative operating models require KPIs to guide executives on where to focus leadership efforts, communications, and process improvements. Efficiency metrics might show the impacts of automation and data-driven decision-making.
While data science and machinelearning are related, they are very different fields. In a nutshell, data science brings structure to big data while machinelearning focuses on learning from the data itself. What is machinelearning? This post will dive deeper into the nuances of each field.
A business user simply selects a KPI of interest, and machinelearning algorithms run automatically across all data points that are related to generate the key reasons “why” a KPI is trending upward or downward. Birst was at the forefront of leveraging advanced automation and machinelearning.
You can also use Power BI to prepare and manage high-quality data to use across the business in other tools, from low-code apps to machinelearning. If you have a data science team, you can also make models from Azure MachineLearning available in Power BI using Power Query.
Any stats, facts, figures, or metrics that don’t align with your business goals or fit with your KPI management strategies should be eliminated from the equation. Exclusive Bonus Content: Why Is Analysis Important? Download our bite-sized guide and unlock your fullest analysis potential! Build a data management roadmap.
By looking at relevant KPI metrics to track progress against specific goals, you can make sure to focus only on the work that is successful and avoid investing your efforts into underperforming areas o areas that are not related to your objectives. If you want to get more insights on the topic, check out our guide on KPI targets and goals. .
These solutions need to be easier to adapt to using artificial intelligence and machinelearning technology. Then, once the data points are collected, the system starts processing them using sophisticated machinelearning algorithms to analyze the data to find the patterns and interconnections.
With tools such as Artificial Intelligence, MachineLearning, and Data Mining, businesses and organizations can collate and analyze large amounts of data reliably and more efficiently. Educators can provide a more valuable learning experience and environment for students. Transforming Industries with Data Intelligence.
CIOs anticipate an increased focus on cybersecurity (70%), data analysis (55%), data privacy (55%), AI/machinelearning (55%), and customer experience (53%). Dental company SmileDirectClub has invested in an AI and machinelearning team to help transform the business and the customer experience, says CIO Justin Skinner.
Most dynamic real time reporting software is powered, to some extent, by machinelearning (ML) capabilities, meaning that it’s insightful, intuitive, and enables you to use your data as a past, predictive, and live decision-making resource. A KPI reporting software can even automate and offer the most recent data in all your reports.
Every data set, every data KPI, or every data field is as important as the app,” she says. Analytics and AI are integral to Kanioura’s vision for PepsiCo’s future, one that centers on enhancing three key pillars: consumer experience, commercial excellence, and operational excellence. Yes, the data is key. But the big unlock is MLops.
It provides data scientists and BI executives with data mining, machinelearning, and data visualization capabilities to build effective data pipelines. . From Google. KNIME is an open-source BI tool specialized for data linkage, integration, and analysis. However, it lacks customization and visual effects compared to other bit tools.
KPI dashboard for Finance (from FineReport). KPI (Key Performance Indicator)-the indicator you will use to measure performance. Data Scientist: A person who uses analytics, statistical tools, and machinelearning to extract actionable value from big data. Which data sources will be used? Free Download.
AI and machinelearning (ML) are not just catchy buzzwords; they’re vital to the future of our planet and your business. So what are the high-level steps to incorporate AI and machinelearning into new and existing products? Then tailor your approach to leverage your unique data and expertise to excel in those KPI areas.
Artificial intelligence and machine-learning algorithms used in those kinds of tools can foresee future values, identify patterns and trends, and automate data alerts. There are countless KPI examples to select and adopt in a strategy, but only the right tracking and analysis can bring profitable results.
Today, analytics efficiency has improved by 30 percent, with the system automatically providing visualized reports and key performance indicator (KPI) statistics to support business decisions and help management contemplate new directions for their respective units.
TIP existing architecture bird’s eye view and scale of the platform The main key performance indicator (KPI) for the TIP platform is its capability to ingest a high volume of security logs from a variety of Salesforce internal systems in real time and process them with high velocity. This is the silver layer of the TIP data lake.
One of our ProServe teams has 19 dashboards on QuickSight, including Catalog, Trend and Analysis, KPI Monitoring, Business Management, and Quality Control. In 2022, one of the KPI Monitoring dashboards helped save at least 5,600 hours in total across 230 managers and 2,000 consultants.
Predictive analytics : This method uses advanced statistical techniques coming from data mining and machinelearning technologies to analyze current and historical data and generate accurate predictions. On the other side of things, BA is more technical.
FanDuel introduced a new internal KPI called Query Efficiency, a measure to capture the amount of time users spent waiting for their queries to run. As the workload started increasing exponentially, FanDuel also noticed an increase in this KPI, specifically for risk and trading workloads.
Migrating to Amazon Redshift offers organizations the potential for improved price-performance, enhanced data processing, faster query response times, and better integration with technologies such as machinelearning (ML) and artificial intelligence (AI). The following table summarizes the relevant platform-level KPIs.
They use advanced technologies such as machinelearning models to generate predictions about future business performance. Main features: Integration with other applications Visual data exploration supported by machinelearning Interactive dashboards and self-service reporting On-the-go analysis with mobile app.
A key goal of AI or machinelearning automation is to have machines complete tasks for you, freeing up time so you can focus on the more complex, higher-value tasks. 1] Until then, we observe in another Gartner survey that organizations are outsourcing various tasks in the MachineLearning pipeline. [2].
Sulla data platform facciamo girare gli algoritmi di machinelearning; alcuni li sviluppiamo in house con le nostre risorse, altri li realizziamo usando componenti esterne che assembliamo, con un approccio composable”. Anche per Carrefour la data platform fornisce la base di partenza per implementare l’intelligenza artificiale.
Start by listing your KPIs. You should have at least one KPI for every part of your product cycle; planning, development, testing, deployment, release, and monitoring. Don’t overlook adding a few KPIs for the active cooperation between different teams (since this is the heart of the DevOps culture). Getting Started.
With this tool, you can track your company’s KPI in real time. As well, you can get automatic insights thanks to the incorporated machinelearning technology that can highlight the most important information for you to take action immediately. You can request a personalized quote at their website. Yellowfin BI.
Anomaly Alerts KPI monitoring and Auto Insights allows business users to quickly establish KPIs and target metrics and identify the Key Influencers and variables for the target KPI.
T he process of digitization across manufacturing has created new sources of data as manufacturers have begun incorporating artificial intelligence (AI), machinelearning, and the increasing use of robotics. What’s the difference between a KPI and a Metric?
With an integrated, mobile approach to BI tools, business users can leverage personalized dashboards, multidimensional key performance indicators, and KPI tools, report software, Crosstab & Tabular reports, GeoMaps and deep dive analytics and enjoy Social BI and collaboration. Auto Insights and toolsets that leverage machinelearning.
By using neural networks, pattern recognition, and machinelearning algorithms, the software can learn about different trends and patterns in your data and notify you as soon as a target is met or if any anomalies occur.
For each transaction, NiFi makes a call to a production model in Cloudera MachineLearning (CML) to score the fraud potential of the transaction. We trained and built a machinelearning (ML) model using Cloudera MachineLearning (CML) to score each transaction according to their potential to be fraudulent.
A Cloudera MachineLearning Workspace exists . The KPI is 0.5 The SDX layer is configured and the users have appropriate access. Company data exists in the data lake. Data Catalog profilers have been run on existing databases in the Data Lake. A Cloudera Data Engineering service exists. The Data Scientist.
Leaders may also want to have a re-look at cost-based analysis for deviation from usual KPI standards, thus allowing maximum usage of stocks lying to fulfill demand even at a higher cost, which had been agreed upon. That is a gap right now.
Amazon Redshift is a popular cloud data warehouse, offering a fully managed cloud-based service that seamlessly integrates with an organization’s Amazon Simple Storage Service (Amazon S3) data lake, real-time streams, machinelearning (ML) workflows, transactional workflows, and much more—all while providing up to 7.9x
This enables the police force to target early interventions on those with known KPI attributes to re-offend to minimise future effects to society. The analytics platform allows WMP to investigate and identify a list of offenders whose criminal activity placed the largest burden on the police force.
QuickSight is a unified BI service providing modern interactive dashboards, natural language querying, paginated reports, machinelearning (ML) insights, and embedded analytics at scale. Powered by ML, Q uses natural language processing (NLP) to answer your business questions quickly.
As you review the list of predictions above, note that traditional and modern BI tools and Augmented Analytics with Natural Language Processing (NLP) and machinelearning seems destined to co-exist for the foreseeable future. KPIs allow the business to establish and monitor KPIs for objective metrics. Cross-Tab Reporting.
We organize all of the trending information in your field so you don't have to. Join 42,000+ users and stay up to date on the latest articles your peers are reading.
You know about us, now we want to get to know you!
Let's personalize your content
Let's get even more personalized
We recognize your account from another site in our network, please click 'Send Email' below to continue with verifying your account and setting a password.


Let's personalize your content