This site uses cookies to improve your experience. To help us insure we adhere to various privacy regulations, please select your country/region of residence. If you do not select a country, we will assume you are from the United States. Select your Cookie Settings or view our Privacy Policy and Terms of Use.
Cookie Settings
Cookies and similar technologies are used on this website for proper function of the website, for tracking performance analytics and for marketing purposes. We and some of our third-party providers may use cookie data for various purposes. Please review the cookie settings below and choose your preference.
Used for the proper function of the website
Used for monitoring website traffic and interactions
Cookie Settings
Cookies and similar technologies are used on this website for proper function of the website, for tracking performance analytics and for marketing purposes. We and some of our third-party providers may use cookie data for various purposes. Please review the cookie settings below and choose your preference.
Strictly Necessary: Used for the proper function of the website
Performance/Analytics: Used for monitoring website traffic and interactions
Image 1 Introduction In this guide, we explore new BI Technology known as Microsoft PowerBI and let us learn some basics of it before we deep dive. I suggest skimming the guide enough, that helps as a building block for learning this […]. This article was published as a part of the Data Science Blogathon.
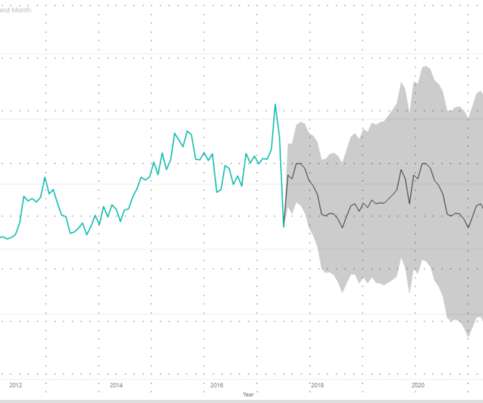
Introduction Time series forecasting is a really important area of Machine Learning as it gives you the ability to “see” ahead of time and. The post Time Series Forecasting using Microsoft PowerBI appeared first on Analytics Vidhya.
Try Metabase, an open-source Business Intelligence (BI) tool for creating interactive dashboards from large datasets. In today’s data-driven world, BI platforms like Metabase are essential for extracting insights and facilitating informed decision-making.
Introduction If you’re new to PowerBI Desktop, this post is for you. You’ll learn the fundamentals of Data Analysis Expressions (DAX) and how to apply them to common math and data analysis tasks in no time. The post Complete Introduction to DAX in PowerBI appeared first on Analytics Vidhya.
Learn how you can bring your own LLM or SLM and enhance your application with embedded analytics and BIpowered by Logi Symphony. Imagine having an AI tool that answers your user’s questions with a deep understanding of the context in their business and applications, nuances of their industry, and unique challenges they face.
Overview Learn about the integration capabilities of PowerBI with Azure Machine Learning (ML) Understand how to deploy machine learning models in a production. The post The Power of Azure ML and PowerBI: Dataflows and Model Deployment appeared first on Analytics Vidhya.
But the BI landscape is evolving and the future of business intelligence is played now, with emerging trends to keep an eye on. In 2020, BI tools and strategies will become increasingly customized. It will also be a year of collaborative BI and artificial intelligence. We are excited to see what this new year will bring.
Amazon DataZone now launched authentication supports through the Amazon Athena JDBC driver, allowing data users to seamlessly query their subscribed data lake assets via popular business intelligence (BI) and analytics tools like Tableau, PowerBI, Excel, SQL Workbench, DBeaver, and more.
Exclusive Bonus Content: Do you know what is BI all about? Learn here! Business intelligence, or “BI” for short, is becoming increasingly prevalent across industries each year. As pattern recognition is a decisive part of BI, artificial intelligence in business intelligence plays a pivotal role in the process.
Speaker: Speakers from SafeGraph, Facteus, AWS Data Exchange, SimilarWeb, and AtScale
Join this webinar to learn how to blend Geospatial data (from SafeGraph), Financial Market and Transaction Data (from Facteus), & Global Websites Visit and Engagement KPIs (from SimilarWeb) to enrich, augment, and improve self-service analytics as well as predictive models. Tuesday, September 14th, 2021 at 11AM PDT, 2PM EDT, 7PM GMT.
We can now achieve the benefits, efficiencies, and data superhero powers that we previously could only imagine. The BI team may be focused on KPIs, forecasts, trends, and decision-support insights. The data science team needs to know and to use that data which the BI team considers to be most important. Now it is a reality.
With this integration, you can now seamlessly query your governed data lake assets in Amazon DataZone using popular business intelligence (BI) and analytics tools, including partner solutions like Tableau. In this post, you learned how the recent enhancements in Amazon DataZone facilitate a seamless connection with Tableau.
This article reflects some of what Ive learned. But heres the question I keep asking myself: do we really need this immense power for most of our analytics? Think about it: LLMs like GPT-3 are incredibly complex deep learning models trained on massive datasets. The hype around large language models (LLMs) is undeniable.
1) Why Shift To A BI Career? 2) Top 10 Necessary BI Skills. 5) Main Challenges Of A BI Career. 6) Main Players In The BI Industry. If you answered yes to any of these questions, you may want to consider a career in business intelligence (BI).In The BI industry is expected to soar to a value of $26.50
Think your customers will pay more for data visualizations in your application? Five years ago they may have. But today, dashboards and visualizations have become table stakes. Discover which features will differentiate your application and maximize the ROI of your embedded analytics. Brought to you by Logi Analytics.
Data has changed our lives in many ways, helping to improve the processes, initiatives, and innovations of organizations across sectors through the power of insight. Learn all about data dashboards with our executive bite-sized summary! How Data Dashboards Are Used In BI. What Is A Data Dashboard? click to enlarge**.
So, what is BI reporting advancing in a business? It provides the possibility to create smart reports with the help of modern BI reporting tools , and develop a comprehensive intelligent reporting practice. As a result, BI can benefit the overall evolution as well as the profitability of a company, regardless of niche or industry.
2) BI vs BA As Seen Through Football. 3) BI And BA Main Differences. 4) How Do BI And BA Apply To Business? 5) BI And BA Use-Case Scenarios. 6) BI And BA Examples. Try our professional BI and analytics software for 14 days free! BI is looking in the rearview mirror and using historical data.
And then there was the other problem: for all the fanfare, Hadoop was really large-scale business intelligence (BI). This is the power of marketing.) BI is useful. They’d grown tired of learning what is; now they wanted to know what’s next. Hello, R and scikit-learn. Don’t get me wrong.
Download this guide for practical advice on how to use a semantic layer to unlock data for AI & BI at scale. You’ll learn how a semantic layer delivers massive ROI with streamlined query performance, concurrency, cost management, and ease of use. How to enable data teams to model and deliver a semantic layer on data in the cloud.
By gaining the ability to understand, quantify, and leverage the power of online data analysis to your advantage, you will gain a wealth of invaluable insights that will help your business flourish. 2) “Deep Learning” by Ian Goodfellow, Yoshua Bengio and Aaron Courville. At present, around 2.7 click for book source**.
For a few years now, Business Intelligence (BI) has helped companies to collect, analyze, monitor, and present their data in an efficient way to extract actionable insights that will ensure sustainable growth. In fact, it is expected that by 2025, the BI market will grow to $33.3 Table of Contents. a) Data Connectors Features.
BI architecture has emerged to meet those requirements, with data warehousing as the backbone of these processes. Exclusive Bonus Content: Wondering about BI & DWH? Learn right here! What Is BI Architecture? One of the BI architecture components is data warehousing. BI Architecture Framework In Modern Business.
The companies that are most successful at marketing in both B2C and B2B are using data and online BI tools to craft hyper-specific campaigns that reach out to targeted prospects with a curated message. Your Chance: Want to try a professional BI analytics software? The power of knowledge. 1) Informed strategic decisions.
To fully leverage the power of data science, scientists often need to obtain skills in databases, statistical programming tools, and data visualizations. In the past, data scientists had to rely on powerful computers to manage large volumes of data. Let’s get started. Here, we list the most prominent ones used in the industry.
Data professionals need to access and work with this information for businesses to run efficiently, and to make strategic forecasting decisions through AI-powered data models. Learn more about how Rocket DataEdge can help organizations bridge the gap between mainframe data and hybrid cloud infrastructure.
Now it’s time to ponder over our hand-picked list of the 20 best SQL learning books available today. Whether you’re a programmer, a data analyst, or a business intelligence end user, knowing the best way to learn SQL is invaluable to anyone dealing with or handling digital data. SQL isn’t just for database administrators (DBAs).
Exclusive Bonus Content: Get Our 2020 BI Buzzwords Handbook! Cognitive computing is a BI buzzword that we will hear more often in 2020. Considered a new big buzz in the computing and BI industry, it enables the digestion of massive volumes of structured and unstructured data that transform into manageable content.
In the rapidly evolving landscape of AI-powered search, organizations are looking to integrate large language models (LLMs) and embedding models with Amazon OpenSearch Service. Bi-encoders are a specific type of embedding model designed to independently encode two pieces of text. Overview of Cohere Rerank 3.5 See Cohere Rerank 3.5
Table of Contents 1) What Is White Label BI? 2) What Is Embedded BI? 3) The Link Between White Label BI & Embedded Analytics 4) An Embedded BI Workflow Example 5) White Labeled Embedded BI Examples In the modern world of business, data holds the key to success. Let’s get started with some definitions!
Now that you’re sold on the power of data analytics in addition to data-driven BI, it’s time to take your journey a step further by exploring how to effectively communicate vital metrics and insights in a concise, inspiring, and accessible format through the power of visualization. They can be fun and interactive, too.
PowerBI is Microsoft’s interactive data visualization and analytics tool for business intelligence (BI). With PowerBI, you can pull data from almost any data source and create dashboards that track the metrics you care about the most. Explore ‘What-ifs’ Like Excel, PowerBI offers slicers for comparing scenarios.
Embedded BI Assures User Adoption of Analytics When a business sets out to initiate data democratization and improve data literacy, it must choose the right approach to business intelligence and select an augmented analytics product that is self-serve, intuitive, easy to implement and easy for business users to embrace.
Get the inside scoop and learn all the new buzzwords in tech for 2020! AI refers to the autonomous intelligent behavior of software or machines that have a human-like ability to make decisions and to improve over time by learning from experience. Exclusive Bonus Content: Download our Top 10 Technology Buzzwords! Computer Vision.
You learn about the return on equity and return on asset, the debt-equity ratio, working capital ratio, but also see the evolution of a share price over time. Niche or sector aside, this most powerful of business reports examples will empower your sales team to improve productivity while increasing revenue on a sustainable basis.
Fabric is here but what does that mean if you are using PowerBI? What do you need to know and what, if anything will you need to change if you are a PowerBI report designer, developer or BI solution architect? PowerBI still works as it always has. The core product is unchanged.
Each of the new packages includes Cloud ERP, business applications, SAP Business Data Cloud (BDC), SAP Business AI, powered by the SAP Business Technology Platform (BTP). (It had previously used the brand for its legacy on-premises product line.)
Your Chance: Want to test a powerful agency analytics software? Your Chance: Want to test a powerful agency analytics software? datapine is an excellent BI software focused on delivering powerful online analysis features with a friendly interface, making it easy to use for anyone. What Are Agency Analytics?
Today, most companies are in the process of implementing various business intelligence strategies, turning to SaaS BI tools to assist them in their efforts. Learn what will enhance the SaaS infrastructure in our free cheat sheet! Learn what will enhance the SaaS infrastructure in our free cheat sheet! 1) Artificial Intelligence.
Almost all the major software companies are continuously making use of the leading Business Intelligence (BI) and Data discovery tools available in the market to take their brand forward. Let us take a look into the individual concepts of social and collaborative business intelligence to learn more about how they help companies.
20, 2024 – insightsoftware , a leader in data & analytics, today announced the availability of Logi Symphony, its flagship embedded business intelligence (BI) solution, on Google Cloud Marketplace. Learn more at insightsoftware.com. We believe an actionable business strategy begins and ends with accessible data.
Armed with powerful visualizations and real-time data, modern weekly summary reports enable businesses to closely monitor their performance and the progress of their strategies to extract relevant insights and optimize their processes to ensure constant growth. This is where interactive weekly reports come into the picture.
Companies like Propel Media are using machine learning to deliver ads to customers that are most likely to convert. And as marketers quickly get used to innovations that significantly improve their work, they tend to generalize AI and BI. Therefore, in the following paragraphs, we would dive into the details of AI and BI.
We organize all of the trending information in your field so you don't have to. Join 42,000+ users and stay up to date on the latest articles your peers are reading.
You know about us, now we want to get to know you!
Let's personalize your content
Let's get even more personalized
We recognize your account from another site in our network, please click 'Send Email' below to continue with verifying your account and setting a password.


Let's personalize your content