This site uses cookies to improve your experience. To help us insure we adhere to various privacy regulations, please select your country/region of residence. If you do not select a country, we will assume you are from the United States. Select your Cookie Settings or view our Privacy Policy and Terms of Use.
Cookie Settings
Cookies and similar technologies are used on this website for proper function of the website, for tracking performance analytics and for marketing purposes. We and some of our third-party providers may use cookie data for various purposes. Please review the cookie settings below and choose your preference.
Used for the proper function of the website
Used for monitoring website traffic and interactions
Cookie Settings
Cookies and similar technologies are used on this website for proper function of the website, for tracking performance analytics and for marketing purposes. We and some of our third-party providers may use cookie data for various purposes. Please review the cookie settings below and choose your preference.
Strictly Necessary: Used for the proper function of the website
Performance/Analytics: Used for monitoring website traffic and interactions
However, the metrics used to evaluate CIOs are hindering progress. While the CIO role has expanded significantly, the metrics used to evaluate their performance often remain tied to traditional IT values like cost management, operational efficiency, and system uptime. The CIO is no longer the chief of “keeping the lights on.”
In our cutthroat digital economy, massive amounts of data are gathered, stored, analyzed, and optimized to deliver the best possible experience to customers and partners. At the same time, inventory metrics are needed to help managers and professionals in reaching established goals, optimizing processes, and increasing business value.
This is no different in the logistics industry, where warehouse managers track a range of KPIs that help them efficiently manage inventory, transportation, employee safety, and order fulfillment, among others. Making the use of warehousing metrics a huge competitive advantage. Let’s dive in with the definition.
Identifying what is working and what is not is one of the invaluable management practices that can decrease costs, determine the progress a business is making, and compare it to organizational goals. Your Chance: Want to visualize & track operational metrics with ease? What Are Metrics And Why Are They Important?
Speaker: Diane Magers, Founder and Chief Experience Officer at Experience Catalysts
To gain buy-in from the C-Suite and key stakeholders, it’s crucial to illustrate how Experience Management translates into clear, measurable business results. Transforming customer engagement, Voice of Customer (VoC) insights, and Journey Maps into tangible financial outcomes poses a significant challenge for most organizations.
However, very few know that an efficient way to do so is by tracking and managing the KPI metrics which would portray the SEO performance of your website. With these things in mind, here are some of the most important SEO metrics and KPIs that you should track for your website: Top 9 SEO Metrics To Track. Bounce Rate.
That’s why it’s critical to monitor and optimize relevant supply chain metrics. Finally, we will show how to combine those metrics with the help of modern KPI software and create professional supply chain dashboards. Your Chance: Want to visualize & track supply chain metrics with ease?
In our previous article, What You Need to Know About Product Management for AI , we discussed the need for an AI Product Manager. In this article, we shift our focus to the AI Product Manager’s skill set, as it is applied to day to day work in the design, development, and maintenance of AI products. The AI Product Pipeline.
1) What Are Productivity Metrics? 3) Productivity Metrics Examples. 4) The Value Of Workforce Productivity Metrics. What Are Productivity Metrics? Productivity metrics are measurements used by businesses to evaluate the performance of employees on various activities related to their general company goals.
Speaker: Mike Rizzo, Founder & CEO, MarketingOps.com and Darrell Alfonso, Director of Marketing Strategy and Operations, Indeed.com
We will dive into the 7 P Model —a powerful framework designed to assess and optimize your marketing operations function. In this exclusive webinar led by industry visionaries Mike Rizzo and Darrell Alfonso, we’re giving marketing operations the recognition they deserve! Secure your seat and register today!
1) What Is Data Quality Management? 6) Data Quality Metrics Examples. However, with all good things comes many challenges and businesses often struggle with managing their information in the correct way. Enters data quality management. What Is Data Quality Management (DQM)? Why Do You Need Data Quality Management?
If you’re already a software product manager (PM), you have a head start on becoming a PM for artificial intelligence (AI) or machine learning (ML). But there’s a host of new challenges when it comes to managing AI projects: more unknowns, non-deterministic outcomes, new infrastructures, new processes and new tools.
Model lifecycle management. There are also many important considerations that go beyond optimizing a statistical or quantitative metric. As we deploy ML in many real-world contexts, optimizing statistical or business metics alone will not suffice. Continue reading Managing risk in machine learning. Data Platforms.
First, cloud provisioning through automation is better in AWS CloudFormation and Azure Azure Resource Manager compared to the other cloud providers. This involves identifying which components can be lifted and shifted directly to the cloud and which might require re-architecture for cloud optimization.
It is a layered approach to managing and transforming data. Data is typically organized into project-specific schemas optimized for business intelligence (BI) applications, advanced analytics, and machine learning. For businesses requiring near-real-time insights, the time taken to traverse multiple layers may also introduce delays.
Here, we’ll examine 18 essential KPIs for social media, explore the dynamics and demonstrate the importance of social metrics in the modern business age with the help of a KPI software , and, finally, wrapping up with tips on how to set KPIs and make the most of your social platforms. Let’s get going. What Are Social Media KPIs?
Also, implementing effective management reports will create a data-driven approach to making business decisions and obtaining sustainable business success. What Is A Project Management Dashboard? Top 3 Benefits Of Project Management Dashboards. The key to successful project management is communication.
Understanding and tracking the right software delivery metrics is essential to inform strategic decisions that drive continuous improvement. In todays digital economy, business objectives like becoming a leading global wealth management firm or being a premier destination for top talent demand more than just technical excellence.
Table of Contents 1) What Is KPI Management? 4) How to Select Your KPIs 5) Avoid These KPI Mistakes 6) How To Choose A KPI Management Solution 7) KPI Management Examples Fact: 100% of statistics strategically placed at the top of blog posts are a direct result of people studying the dynamics of Key Performance Indicators, or KPIs.
Although traditional scaling primarily responds to query queue times, the new AI-driven scaling and optimization feature offers a more sophisticated approach by considering multiple factors including query complexity and data volume. Consider using AI-driven scaling and optimization if your current workload requires 32 to 512 base RPUs.
Aligning ESG and technological innovation At the core of this transformation is the CIO, a pivotal player whose role has expanded beyond managing technological innovation to overseeing how these innovations contribute to ESG goals.
What CIOs can do: Avoid and reduce data debt by incorporating data governance and analytics responsibilities in agile data teams , implementing data observability , and developing data quality metrics. Another concern is if regulations force holistic model retraining, forcing CIOs to switch to alternatives to remain compliant.
They have demonstrated that robust, well-managed data processing pipelines inevitably yield reliable, high-quality data. Their data tables become dependable by-products of meticulously crafted and managed workflows. Each workflow is managed systematically, simplifying the integration of new data sources.
1) What Are Product Metrics? 2) Types Of Product Metrics. 3) Product Metrics Examples You Can Use. 4) Product Metrics Framework. Managing to develop an effective product roadmap goes beyond a product manager’s (PM) vision or intuition, even if these aspects matter as well. What Are Product Metrics?
If we want prosocial outcomes, we need to design and report on the metrics that explicitly aim for those outcomes and measure the extent to which they have been achieved. They were not imposed from without, but were adopted because they allowed merchants to track and manage their own trading ventures.
Amazon Managed Workflows for Apache Airflow (Amazon MWAA), is a managed Apache Airflow service used to extract business insights across an organization by combining, enriching, and transforming data through a series of tasks called a workflow. This approach offers greater flexibility and control over workflow management.
But how do you manage all your new clients while still focusing on giving them a good service and their expected results? As with any other business out there, agencies manage big amounts of data in the form of surveys, social media metrics, website performance, or any other information related to their client’s goals.
Azures growing adoption among companies leveraging cloud platforms highlights the increasing need for effective cloud resource management. Enterprises must focus on resource provisioning, automation, and monitoring to optimize cloud environments. Automation helps optimize resource allocation and minimize operational inefficiencies.
Managed, on the other hand, it can boost operations, efficiency, and resiliency. In another Foundry survey , decision-makers across all industries cited increased productivity (42%), improved decision-making (40%) and optimized content performance (40%) as top potential benefits of AI-enabled content management. The good news?
This powerful CFO dashboard example allows you to connect another dashboard within its framework with ease while integrating additional insights, including market indicators, consumer analysis, investor relations, monetary management, and more. Top 7 CFO Dashboard KPIs & Metrics Explained.
REA Group, a digital business that specializes in real estate property, solved this problem using Amazon Managed Streaming for Apache Kafka (Amazon MSK) and a data streaming platform called Hydro. In each environment, Hydro manages a single MSK cluster that hosts multiple tenants with differing workload requirements.
With the advent of generative AI, therell be significant opportunities for product managers, designers, executives, and more traditional software engineers to contribute to and build AI-powered software. Slow response/high cost : Optimize model usage or retrieval efficiency. How do we do so? We tested both retrieval quality (e.g.,
CIOs feeling the pressure will likely seek more pragmatic AI applications, platform simplifications, and risk management practices that have short-term benefits while becoming force multipliers to longer-term financial returns. CIOs should consider placing these five AI bets in 2025.
We won’t delve into details about the career prospects of this C-level position but we will present COO dashboards and reports that are critical for helping chief operating officers across the world to effectively manage their time, company, operational processes, and results. Choose the most valuable metrics for your industry.
For the first time, we’re consolidating data to create real-time dashboards for revenue forecasting, resource optimization, and labor utilization. But more than anything, the data platform is putting decision-making tools in the hands of our business so people can better manage their operations. How is the new platform helping?
To ensure that your customer-facing communications and efforts are constantly improving and evolving, investing in customer relationship management (CRM) is vital. With a powerful dashboard maker , each point of your customer relations can be optimized to maximize your performance while bringing various additional benefits to the picture.
Amazon OpenSearch Service introduced the OpenSearch Optimized Instances (OR1) , deliver price-performance improvement over existing instances. For more details about OR1 instances, refer to Amazon OpenSearch Service Under the Hood: OpenSearch Optimized Instances (OR1). OR1 instances use a local and a remote store.
But wait, she asks you for your team metrics. At DataKitchen, we have talked with many CDOs, data leaders, and other data team managers, and they have, ironically, been very un-analytic about how they run their teams. Where is your metrics report? Forty-five metrics! You’ve got a new boss. What should I track?
We outline cost-optimization strategies and operational best practices achieved through a strong collaboration with their DevOps teams. We also discuss a data-driven approach using a hackathon focused on cost optimization along with Apache Spark and Apache HBase configuration optimization. This sped up their need to optimize.
Managers, employees, and important stakeholders often can be stuck by waiting for a comprehensive BI report from the IT department or SQL developers. The data-driven world doesn’t have to be overwhelming, and with the right BI tools , the entire process can be easily managed with a few clicks. Increasing the workflow speed.
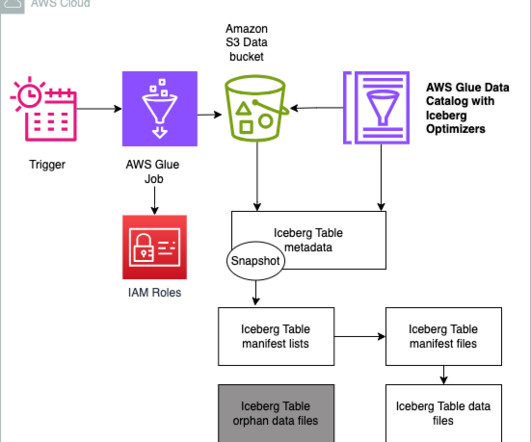
The AWS Glue Data Catalog now enhances managed table optimization of Apache Iceberg tables by automatically removing data files that are no longer needed. With this launch, you can enable Glue Data Catalog table optimization to include snapshot and orphan data management along with compaction.
Likes, comments, shares, reach, CTR, conversions – all have become extremely significant to optimize and manage regularly in order to grow in our competitive digital environment. If you get into details, you will know what kind of metrics you need to accompany with your analysis. What Is A Social Media Dashboard?
From the CEO’s perspective, an optimized IT services portfolio maximizes cost efficiency, flexibility, and scalability. It enables the organization to focus on its core business while managing risks and accelerating time-to-market for new products and services.
We organize all of the trending information in your field so you don't have to. Join 42,000+ users and stay up to date on the latest articles your peers are reading.
You know about us, now we want to get to know you!
Let's personalize your content
Let's get even more personalized
We recognize your account from another site in our network, please click 'Send Email' below to continue with verifying your account and setting a password.


Let's personalize your content