This site uses cookies to improve your experience. To help us insure we adhere to various privacy regulations, please select your country/region of residence. If you do not select a country, we will assume you are from the United States. Select your Cookie Settings or view our Privacy Policy and Terms of Use.
Cookie Settings
Cookies and similar technologies are used on this website for proper function of the website, for tracking performance analytics and for marketing purposes. We and some of our third-party providers may use cookie data for various purposes. Please review the cookie settings below and choose your preference.
Used for the proper function of the website
Used for monitoring website traffic and interactions
Cookie Settings
Cookies and similar technologies are used on this website for proper function of the website, for tracking performance analytics and for marketing purposes. We and some of our third-party providers may use cookie data for various purposes. Please review the cookie settings below and choose your preference.
Strictly Necessary: Used for the proper function of the website
Performance/Analytics: Used for monitoring website traffic and interactions
Introduction In the field of Data Science main types of online processing systems are Online Transaction Processing (OLTP) and Online Analytical Processing (OLAP), which are used in most companies for transaction-oriented applications and analytical work. In the Database Management System, both OLAP and OLTP play […].
One of the most valuable tools available is OLAP. Using OLAP Tools Properly. Trend analysis, financial reporting, and sales forecasting are frequently aided by OLAP business intelligence queries. ( Several or more cubes are used to separate OLAP databases. OLAP’s disadvantages. see more ).
Introduction DuckDB is designed to support analytical query workloads, also known as Online analytical processing (OLAP).” ” The duck was chosen as the mascot for this database management system (DBMS) because it is a very versatile animal that can fly, walk and swim. In short, […].
How much time has your BI team wasted on finding data and creating metadata management reports? This is how the Online Analytical Processing (OLAP) cube was born, which you might call one of the grooviest BI inventions developed in the 70s. The OLAP cube makes reading data across multiple dimensions manageable.
Online analytical processing (OLAP) database systems and artificial intelligence (AI) complement each other and can help enhance data analysis and decision-making when used in tandem. As AI techniques continue to evolve, innovative applications in the OLAP domain are anticipated.
Amazon Redshift is a fully managed, petabyte-scale, massively parallel data warehouse that makes it fast, simple, and cost-effective to analyze all your data using standard SQL and your existing business intelligence (BI) tools. Solution overview Online Analytical Processing (OLAP) is an effective tool for today’s data and business analysts.
Online Analytical Processing (OLAP) is crucial in modern data-driven apps, acting as an abstraction layer connecting raw data to users for efficient analysis. OLAP combines data from various data sources and aggregates and groups them as business terms and KPIs. You can use Amazon Managed Service for Apache Flink service.
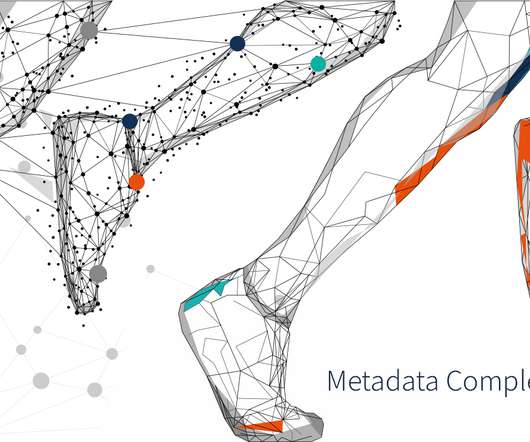
As 2019 comes to a close, we think it’s the perfect time to review trends in metadata management as well as look at some of Octopai’s own highlights. Metadata is everywhere and its success depends on deploying the right resources for its management. Expanded our support of Microsoft OLAP cube , an innovative open-source feat.
PARIS Tech and partner David Newton from Newton Carmen have collaborated to create an OLAP model for analysing the 2023 Rugby World Cup. Using this data model, full of every Rubgy stat imaginable, we’ve run a video series of over20 different scenarios. Turns out we were able to predict the South African winners!
Management Reporter (MR) replaced the retired FRx financial writing tool back in 2011, and now Microsoft has stopped making any major investments into the tool altogether. What to Consider Before Replacing Management Reporter. Why Replace FrX and Management Reporter with Jet? Management Reporter. Management Reporter.
The post Dreamkillers – Analyzing the 2023 Rugby World Cup with OLAP Cube Technology first appeared on PARIS Tech. We’ve created a Rugby World Cup model with an array of versions, predicting diverse outcomes for matches at different stages of the event.
OLTP vs OLAP. First, we’ll dive into the two types of databases: OLAP (Online Analytical Processing) and OLTP (Online Transaction Processing). An OLAP database is best for situations where you read from the database more often than you write to it. OLAP databases excel at queries that require large table scans (e.g.
Report Management . User Management . Metabase is an open-source business intelligence tool that allows you to manage database, monitor KPI, track bug, filer record, generate dashboards with simple ad hoc queries without using complex SQL statements. Dynamic reports. Query reports. HTML5 charts . Task Scheduler. Task Scheduler.
A DSS supports the management, operations, and planning levels of an organization in making better decisions by assessing the significance of uncertainties and the tradeoffs involved in making one decision over another. These systems help managers monitor performance indicators. These systems suggest or recommend actions to managers.
For example, a company that wants to better manage its supply chain needs BI capabilities to determine where delays are happening and where variabilities exist within the shipping process. BI aims to deliver straightforward snapshots of the current state of affairs to business managers.
As a matter of necessity, finance teams also produce financial statements for internal use by a company’s management team. Broadly speaking, these kinds of reports fall under the heading of “operational reporting”, because you use them as part of routine operations rather than as a financial management tool.
If your company is using Microsoft Dynamics AX, you’ll be aware of the company’s shift to Microsoft Dynamics 365 Finance and Supply Chain Management (D365 F&SCM). For more powerful, multidimensional OLAP-style reporting, however, it falls short. OLAP reporting has traditionally relied on a data warehouse.
The former is more professional in report making, presentation, and printing, while the latter can make OLAP and predict analysis thanks to the BI capabilities. As reporting software, it does not support OLAP. Best for: C XOs, sales managers, analysts, consultants . Cube management logic is growing old. FineReport.
When Microsoft released the next generation of the product in 2017, Microsoft Dynamics 365 for Finance and Supply Chain Management (D365F&SCM) , there were some significant changes behind the scenes. Online analytical processing (OLAP), which enabled users to quickly and easily view data along different dimensions, was coming of age.
Uber focused on contributing to several key areas within Presto: Automation: To support growing usage, the Uber team went to work on automating cluster management to make it simple to keep up and running. Workload Management: Because different kinds of queries have different requirements, Uber made sure that traffic is well-isolated.
Data warehouses are a means of taking data points from disparate touchpoints (such as point-of-sale, CRM, inventory, and warehouse management systems), standardizing the data collected, structuring it to extract necessary insights, and running analysis. Enter data warehousing.
Many enterprises are eager to build a reporting system to solve the problems of report generation and management. And it is supposed to provide a report portal for managers to manage and distribute reports. The underlying data is in charge of data management, covering data collection, ETL, building a data warehouse, etc.
Technicals such as data warehouse, online analytical processing (OLAP) tools, and data mining are often binding. On the opposite, it is more of a comprehensive application of data warehouse, OLAP, data mining, and so forth. They are about storing, processing, analyzing, displaying, and managing data within the company.
Business intelligence (BI) software can help by combining online analytical processing (OLAP), location intelligence, enterprise reporting, and more. Store and manage: Next, businesses store and manage the data in a multidimensional database system, such as OLAP or tabular cubes. Toiling Away in the Data Mines.
Model-based analysis like OLAP analysis on cubes or ad hoc analysis based on semantic models provides greater flexibility for end users to pull information out of their information landscape. Standard or enterprise reporting is used in almost every company (95 percent, see Figure 1) leaving little room for improvement.
Relational databases emerged in the 1970s, enabling more advanced data management. In the 1990s, OLAP tools allowed multidimensional data analysis. Moreover, sentiment analysis can unveil public perceptions and brand sentiment, offering opportunities for reputation management. Let’s break it down for you.
The OLAP.com blog recently published an article discussing the use of OLAP cube technology in analyzing and predicting outcomes for the 2023 Rugby World Cup. Cube technology or “OLAP” is a multi-dimensional database commonly used in Finance and Accounting for analysis, though it
This is a graph of millions of edges and vertices – in enterprise data management terms it is a giant piece of master/reference data. To handle such scenarios you need a transalytical graph database – a database engine that can deal with both frequent updates (OLTP workload) as well as with graph analytics (OLAP).
When looking to change ETLs for instance, or understand or design an ETL process, it is now possible to download the lineage to Excel in order to document changes as part of the change management process, do sign offs etc. Download upper and column-to-column lineage to Excel/CSV in order to document, verify development and change requests.
From a data management perspective, this means that you must have a handle on where your data is located, what is contained within it, who has access to it, how it’s used, shared, and protected. Octopai's Automated Metadata Management Platform can make CCPA compliance a breeze. Keeping the Lights On with Automated Metadata Management.
Accelerate threat detection and response (TDR) using AI-powered centralized log management and security observability It is not news to most that cyberattacks have become easier to launch and harder to stop as attackers have gotten smarter and faster. For those defending against cyberthreats, things continue to get more complicated.
For organizations considering a move to Microsoft Dynamics 365 Finance & Supply Chain Management (D365 F&SCM), or for those in the early stages of an implementation project, defining a clear strategy for curating data is a key to developing a comprehensive approach to reporting and analytics. Enterprise Business Intelligence.
TIBCO Jaspersoft offers a complete BI suite that includes reporting, online analytical processing (OLAP), visual analytics , and data integration. Online Analytical Processing (OLAP). The information is typically displayed and managed by a BI platform. Insights can also be shared externally with a single click. Source: [link] ].
The core steps are generating reports based on the business data, distributing reports, and managing the reports. . The enterprise reporting portal also helps organize and manage reports according to business topics to facilitate users to find reports easily. Enterprise Reporting Strategy .
In daily work, when business develops to a relatively large scale, we will all face variable management problems. In addition, it can extract useful data from different business systems of an enterprise for storing, analyzing, and managing internal data. OLAP is a data analysis tool based on data warehouse environment.
Amazon Redshift is a fully managed, petabyte-scale data warehouse service in the cloud. About the authors Yanzhu Ji is a Product Manager in the Amazon Redshift team. Tens of thousands of customers use Amazon Redshift to process exabytes of data every day to power their analytics workloads.
Data warehouses are a means of taking data points from disparate touchpoints (such as point-of-sale, CRM, inventory, and warehouse management systems), standardizing the data collected, structuring it to extract necessary insights, and running analysis. Enter data warehousing.
If you have advanced requirements for OLAP analysis or prediction, the BI suite is a better choice. . The web portal for enterprise reporting provides a very secure environment for reports management, access controls, automated reporting, and so on. How does BI Reporting Work? Powerful Decision-making Platform .
Most organizations are looking for sophisticated reporting and analytics, but they have little appetite for managing the highly complicated infrastructure that goes with it. OLAP Cubes vs. Tabular Models. The first is an OLAP model. To perform multidimensional analysis on large data sets, OLAP data were organized into “cubes.”
They are designed for operational staff like accountants, AP clerks, fulfillment managers, or salespeople to delay the lag between an eminent business need and the required action. Therefore, the real magic happens when OLAP cubes are built or delivered from the data warehouse. Or, a weekly AP report can initiate a payment.
Finance teams often work with business intelligence (BI) tools to analyze data, identify trends, pinpoint discrepancies, and build informative, compelling reports for management. A non-developer can easily build a basic data warehouse including OLAP Cube or Tabular Model with Jet Analytics in as little as 30 minutes.
Over time, accounting software evolved to include inventory management, human resources, and even CRM. This practice, together with powerful OLAP (online analytical processing) tools, grew into a body of practice that we call “business intelligence.” Along came ERP, and new opportunities opened up for greater efficiency and growth.
At PARIS, you may have noticed that recently, we’ve added a touch of fun concerning “version maintenance” as a business idea by intertwining it with—of all things!—Rugby Rugby World Cup data. Now, in the context of the Rugby World Cup—which event is coming up quickly—the notion of version maintenance may seem unconventional, yet we believe that
This puts tremendous stress on the teams managing data warehouses, and they struggle to keep up with the demand for increasingly advanced analytic requests. Though data warehouse automation has been around for more than a decade, the demand for it among business intelligence teams, IT departments, and corporate management is increasing.
We organize all of the trending information in your field so you don't have to. Join 42,000+ users and stay up to date on the latest articles your peers are reading.
You know about us, now we want to get to know you!
Let's personalize your content
Let's get even more personalized
We recognize your account from another site in our network, please click 'Send Email' below to continue with verifying your account and setting a password.


Let's personalize your content