This site uses cookies to improve your experience. To help us insure we adhere to various privacy regulations, please select your country/region of residence. If you do not select a country, we will assume you are from the United States. Select your Cookie Settings or view our Privacy Policy and Terms of Use.
Cookie Settings
Cookies and similar technologies are used on this website for proper function of the website, for tracking performance analytics and for marketing purposes. We and some of our third-party providers may use cookie data for various purposes. Please review the cookie settings below and choose your preference.
Used for the proper function of the website
Used for monitoring website traffic and interactions
Cookie Settings
Cookies and similar technologies are used on this website for proper function of the website, for tracking performance analytics and for marketing purposes. We and some of our third-party providers may use cookie data for various purposes. Please review the cookie settings below and choose your preference.
Strictly Necessary: Used for the proper function of the website
Performance/Analytics: Used for monitoring website traffic and interactions
Business value : Once we have a rubric for evaluating our systems, how do we tie our macro-level business value metrics to our micro-level LLM evaluations? How will you measure success? So now we have a user persona, several scenarios, and a way to measure success. How do we do so? We asked them: Who are you building it for?
To win in business you need to follow this process: Metrics > Hypothesis > Experiment > Act. We are far too enamored with data collection and reporting the standard metrics we love because others love them because someone else said they were nice so many years ago. That metric is tied to a KPI.
If we want prosocial outcomes, we need to design and report on the metrics that explicitly aim for those outcomes and measure the extent to which they have been achieved. But alignment will be impossible without robust institutions for disclosure and auditing. That is a crucial first step, and we should take it immediately.
Machine learning adds uncertainty. Underneath this uncertainty lies further uncertainty in the development process itself. There are strategies for dealing with all of this uncertainty–starting with the proverb from the early days of Agile: “ do the simplest thing that could possibly work.”
We live in a time of uncertainty, not unpredictability. The point of contingency planning is to provide thoughtful answers to that question, including the impact of various scenarios on financial statements, profitability, market share and operating metrics. Or, at least enduring the least amount of damage.
Ideally, AI PMs would steer development teams to incorporate I/O validation into the initial build of the production system, along with the instrumentation needed to monitor model accuracy and other technical performance metrics. But in practice, it is common for model I/O validation steps to be added later, when scaling an AI product.
This is due, on the one hand, to the uncertainty associated with handling confidential, sensitive data and, on the other hand, to a number of structural problems. Solid reporting provides transparent, consistent and combined HR metrics essential for strategic planning, risk management and the management of HR measures.
by AMIR NAJMI & MUKUND SUNDARARAJAN Data science is about decision making under uncertainty. Some of that uncertainty is the result of statistical inference, i.e., using a finite sample of observations for estimation. But there are other kinds of uncertainty, at least as important, that are not statistical in nature.
The uncertainty of not knowing where data issues will crop up next and the tiresome game of ‘who’s to blame’ when pinpointing the failure. Moreover, advanced metrics like Percentage Regional Sales Growth can provide nuanced insights into business performance. One of the primary sources of tension?
This involves identifying, quantifying and being able to measure ethical considerations while balancing these with performance objectives. Systems should be designed with bias, causality and uncertainty in mind. Uncertainty is a measure of our confidence in the predictions made by a system. System Design. Model Drift.
Businesses worldwide, especially SaaS businesses, have discovered that smart, measurable content marketing is the key to achieving their business goals. Then, you can simply plan, create, measure, optimize and repeat. Several metrics exist to help you figure this out. Measure the impact of decisions.
They are afraid of failure and the uncertainty of knowledge work, and so that’s stressful. Agile is an amazing risk management tool for managing uncertainty, but that’s not always obvious.” The key is recognizing that planning must be an agile discipline, not a standalone activity performed independently of agile teams.
Consistency and agreement Establish an agreement metric (e.g., Cohen’s Kappa) to measure inter-annotator agreement. Address their questions and clarify any uncertainties promptly. This helps ensure consistency among annotators and identifies areas of ambiguity in guidelines that need improvement.
This classification is based on the purpose, horizon, update frequency and uncertainty of the forecast. Tactical vs strategic forecasts Forecasting problems may be usefully characterized on a continuum between tactical on the one hand, and strategic on the other. These characteristics of the problem drive the forecasting approaches.
Digital disruption, global pandemic, geopolitical crises, economic uncertainty — volatility has thrown into question time-honored beliefs about how best to lead IT. Thriving amid uncertainty means staying flexible, he argues. . Demand transparency on everything — especially on metrics — and be transparent back.
Now that every industry is facing a prolonged period of uncertainty, having access to accurate, up-to-date information is more critical than ever. With so much uncertainty on the horizon, everyone in the construction industry needs to be at the top of their game , especially in terms of finance and accounting. Bonding Capacity.
Although the absolute metrics of the sparse vector model can’t surpass those of the best dense vector models, it possesses unique and advantageous characteristics. Performance evaluation of retrieval In RAG knowledge retrieval, we usually focus on the relevance of top results, so our evaluation uses recall@4 as the metric indicator.
As companies grapple with economic shutdowns, plummeting revenues, market instability, and economic uncertainty now and into the foreseeable future, they need financial insights more than ever before. It’s exactly the kind of capability companies need to move forward with any measure of clarity and confidence.
Government executives face several uncertainties as they embark on their journeys of modernization. How to quantify the impact : Quantify, articulate and measure the expected long-term benefit of a capability to justify the investment. The pain point tracker clusters the foundational data in which value metrics are then applied.
And it’s possible to become lost in the minutiae of the many different metrics available to measure an organisation’s AR capabilities. Analysing the necessary data is a massive undertaking, and one that can draw finance professionals away from other tasks.
To effectively identify what measures need to be taken, analytics can help to summarize and predict how companies should evolve to survive in a challenging environment. Now is the time to apply the full force of business intelligence used by analytics teams to help navigate growing uncertainty. While companies such as Adobe Inc.,
Let's go look at some tools… Measuring "Invisible Virality": Tynt. Please click on the above image for a higher resolution version , including all the other metrics.]. It measures how often a blog post is tweeted/retweeted. It measures how often a blog post is tweeted/retweeted. People matter.
Of course, any mistakes by the reviewers would propagate to the accuracy of the metrics, and the metrics calculation should take into account human errors. If we could separate bad videos from good videos perfectly, we could simply calculate the metrics directly without sampling. The missing verdicts create two problems.
This is probably the first time ever that we are witnessing a demand, a supply, and also a resource uncertainty. And if you’re a banker or an insurer, you’re probably busy figuring out how to measure these risks, mobilize these resources, and fund capital that’s going to provide strong growth. These are strange times.
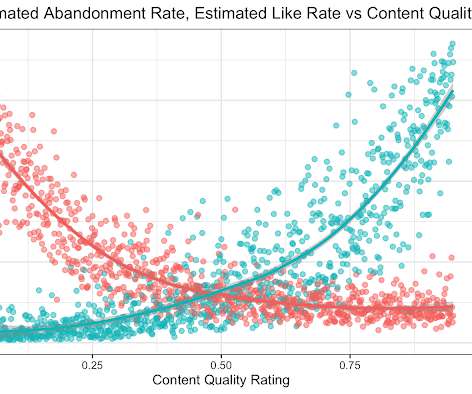
the weight given to Likes in our video recommendation algorithm) while $Y$ is a vector of outcome measures such as different metrics of user experience (e.g., Crucially, it takes into account the uncertainty inherent in our experiments. the fraction of video recommendations resulted in positive user experiences).
Ensure that product managers work on projects that matter to the business and/or are aligned to strategic company metrics. These measurement-obsessed companies have an advantage when it comes to AI. Another pattern that I’ve seen in good PMs is that they’re very metric-driven. That’s another pattern.
As businesses around the world look to move past the uncertainty and unprecedented change of 2020 and toward a fresh start in 2021, the discussion around FP&A maturity has been renewed. A: “The maturity curve is essentially a measure of efficacy for the FP&A function. It has two main purposes.
Since the onset of the coronavirus crisis, businesses around the world are facing an unprecedented level of uncertainty. Most companies monitor some common metrics to make sure they are on track to maintain a sustainable level of cash into the foreseeable future. This is true of other metrics as well.
Clearly, when we work with data and machine learning, we’re swimming in those waters of decision-making under uncertainty. The most poignant for me was a simple approach for measuring noise within an organization. Measure how these decisions vary across your population. Worse than flipping a coin!
This module validates your ability to measure, assess, and develop the Service Desk practice capability using the ITIL Maturity Model. It covers challenges around volatility, uncertainty, complexity, and ambiguity (VUCA) and how to conduct a full cost benefit analysis to identify potential risks and opportunities.
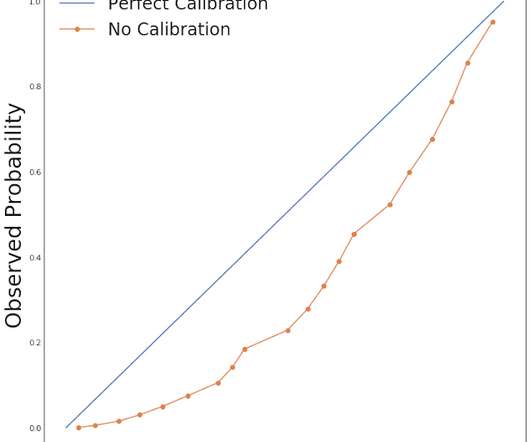
The numerical value of the signal became decoupled from the event it was measuring even as the ordinal value remained unchanged. Calibration and other considerations Calibration is a desirable property, but it is not the only important metric. bar{pi} (1 - bar{pi})$: This is the irreducible loss due to uncertainty.
After sifting through several year’s worth of formally written data, analytics, and data and analytics strategies, we found about 85% of them did not include a measurable business outcome. See Data and Analytics Strategies Need More-Concrete Metrics of Success. The article notes this as cognitive uncertainty. It’s called ROAR.
This piece was prompted by both Olaf’s question and a recent article by my friend Neil Raden on his Silicon Angle blog, Performance management: Can you really manage what you measure? It is hard to account for such tweaking in measurement systems. Pertinence and fidelity of metrics developed from Data.
That’s not surprising, given the uncertainty of the current global economic climate. Our CEO wants key metrics/KPIs on an up-to-the-minute basis. In the case of reporting tools, report distribution capabilities are extraordinarily helpful, provided that their design includes good security measures. Integrated e-commerce.
Forecasting acts as a planning tool to help enterprises prepare for the uncertainty that can occur in the future. The data contains measurements of electric power consumption in different households for the year 2014. The OBJECTIVE parameter specifies a metric to minimize or maximize the objective of a job.
A decade ago, data people delivered a lot less bad news because so little could be measured with any degree of confidence. In 2019, we can measure the crap out of so much. Bubble Kings most commonly reside in organizations where there is little to no accountability (or misplaced accountability, ex: celebration of vanity metrics).
Alternatively, some in the European Union are shifting their priority from trying to run operations faster, to trying to run them with lower power consumption. As with DPUs, more research and quantifiable comparisons are needed to support customers in determining whether composable infrastructure is right for their next system.
Living through periods of rapid upheaval and uncertainty, like the recent pandemic, forces us to adapt quickly to new working practices. One area that often goes overlooked is the value that can be achieved from the application of consolidated KPIs to measure major indicators.
It is important that we can measure the effect of these offline conversions as well. Panel studies make it possible to measure user behavior along with the exposure to ads and other online elements. Let's take a look at larger groups of individuals whose aggregate behavior we can measure. days or weeks).
Note also that this account does not involve ambiguity due to statistical uncertainty. As you can see from the tiny confidence intervals on the graphs, big data ensured that measurements, even in the finest slices, were precise. The mechanism and code path for this data were completely different from our click-based measurements.
E ven after we account for disagreement, human ratings may not measure exactly what we want to measure. Researchers and practitioners have been using human-labeled data for many years, trying to understand all sorts of abstract concepts that we could not measure otherwise. That’s the focus of this blog post.
On top of this, Relex added instructions to its prompt to avoid answering any questions outside the company’s knowledge base, he says, and to express uncertainty when the question was at the limits of its knowledge or skills. Other hyperscalers also offer guardrails that work with their gen AI platforms.
Such decisions involve an actual hypothesis test on specific metrics (e.g. Often, an established product will have an overall evaluation criterion (OEC) that incorporates trade-offs among important metrics and between short- and long-term success. The metrics to measure the impact of the change might not yet be established.
Unlike experimentation in some other areas, LSOS experiments present a surprising challenge to statisticians — even though we operate in the realm of “big data”, the statistical uncertainty in our experiments can be substantial. We must therefore maintain statistical rigor in quantifying experimental uncertainty.
We organize all of the trending information in your field so you don't have to. Join 42,000+ users and stay up to date on the latest articles your peers are reading.
You know about us, now we want to get to know you!
Let's personalize your content
Let's get even more personalized
We recognize your account from another site in our network, please click 'Send Email' below to continue with verifying your account and setting a password.


Let's personalize your content