This site uses cookies to improve your experience. To help us insure we adhere to various privacy regulations, please select your country/region of residence. If you do not select a country, we will assume you are from the United States. Select your Cookie Settings or view our Privacy Policy and Terms of Use.
Cookie Settings
Cookies and similar technologies are used on this website for proper function of the website, for tracking performance analytics and for marketing purposes. We and some of our third-party providers may use cookie data for various purposes. Please review the cookie settings below and choose your preference.
Used for the proper function of the website
Used for monitoring website traffic and interactions
Cookie Settings
Cookies and similar technologies are used on this website for proper function of the website, for tracking performance analytics and for marketing purposes. We and some of our third-party providers may use cookie data for various purposes. Please review the cookie settings below and choose your preference.
Strictly Necessary: Used for the proper function of the website
Performance/Analytics: Used for monitoring website traffic and interactions
Probability is a cornerstone of statistics and data science, providing a framework to quantify uncertainty and make predictions. Probability measures the likelihood of an event […] The post What are Joint, Marginal, and Conditional Probability? This article unpacks these concepts with clear explanations and examples.
by AMIR NAJMI & MUKUND SUNDARARAJAN Data science is about decision making under uncertainty. Some of that uncertainty is the result of statistical inference, i.e., using a finite sample of observations for estimation. But there are other kinds of uncertainty, at least as important, that are not statistical in nature.
All you need to know for now is that machine learning uses statistical techniques to give computer systems the ability to “learn” by being trained on existing data. Machine learning adds uncertainty. Underneath this uncertainty lies further uncertainty in the development process itself.
In addition, they can use statistical methods, algorithms and machine learning to more easily establish correlations and patterns, and thus make predictions about future developments and scenarios. Companies should then monitor the measures and adjust them as necessary. Big data and analytics provide valuable support in this regard.
It’s no surprise, then, that according to a June KPMG survey, uncertainty about the regulatory environment was the top barrier to implementing gen AI. So here are some of the strategies organizations are using to deploy gen AI in the face of regulatory uncertainty. AI is a black box.
AI and Uncertainty. Some people react to the uncertainty with fear and suspicion. Recently published research addressed the question of “ When Does Uncertainty Matter?: Understanding the Impact of Predictive Uncertainty in ML Assisted Decision Making.”. People are unsure about AI because it’s new. AI you can trust.
This classification is based on the purpose, horizon, update frequency and uncertainty of the forecast. With those stakes and the long forecast horizon, we do not rely on a single statistical model based on historical trends. These characteristics of the problem drive the forecasting approaches.
This involves identifying, quantifying and being able to measure ethical considerations while balancing these with performance objectives. Systems should be designed with bias, causality and uncertainty in mind. Uncertainty is a measure of our confidence in the predictions made by a system. System Design. Model Drift.
The foundation should be well structured and have essential data quality measures, monitoring and good data engineering practices. Of course, the findings need to add value, but how do we measure this success? Measures can be financial, tying in with the business strategy. After all, it can sound a bit woolly!
Bootstrap sampling techniques are very appealing, as they don’t require knowing much about statistics and opaque formulas. Instead, all one needs to do is resample the given data many times, and calculate the desired statistics. Don’t compare confidence intervals visually. Pitfall #1: Inaccurate confidence intervals.
First, you figure out what you want to improve; then you create an experiment; then you run the experiment; then you measure the results and decide what to do. For each of them, write down the KPI you're measuring, and what that KPI should be for you to consider your efforts a success. Measure and decide what to do.
Most commonly, we think of data as numbers that show information such as sales figures, marketing data, payroll totals, financial statistics, and other data that can be counted and measured objectively. All descriptive statistics can be calculated using quantitative data. Digging into quantitative data. or “how often?”
We could argue that the signal-to-noise ratio is the most essential consideration in data visualization—the fundamental guide for all design decisions while creating a data visualization and the fundamental measure of success once it’s out there in the world.
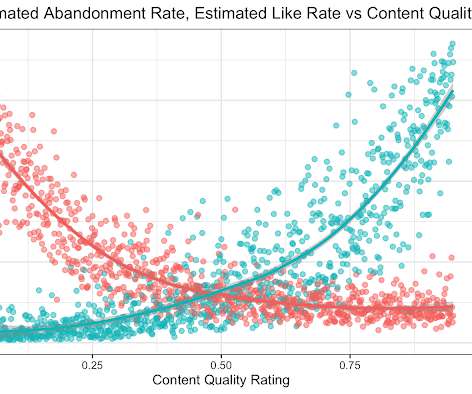
the weight given to Likes in our video recommendation algorithm) while $Y$ is a vector of outcome measures such as different metrics of user experience (e.g., Crucially, it takes into account the uncertainty inherent in our experiments. Figure 2: Spreading measurements out makes estimates of model (slope of line) more accurate.
For example, imagine a fantasy football site is considering displaying advanced player statistics. A ramp-up strategy may mitigate the risk of upsetting the site’s loyal users who perhaps have strong preferences for the current statistics that are shown. One reason to do ramp-up is to mitigate the risk of never before seen arms.
But importance sampling in statistics is a variance reduction technique to improve the inference of the rate of rare events, and it seems natural to apply it to our prevalence estimation problem. Statistical Science. Statistics in Biopharmaceutical Research, 2010. [4] High Risk 10% 5% 33.3% How Many Strata? 16 (2): 101–133. [3]
Overnight, the impact of uncertainty, dynamics and complexity on markets could no longer be ignored. Local events in an increasingly interconnected economy and uncertainties such as the climate crisis will continue to create high volatility and even chaos. The COVID-19 pandemic caught most companies unprepared. BARC Recommendations.
Quantification of forecast uncertainty via simulation-based prediction intervals. First, the system may not be understood, and even if it was understood it may be extremely difficult to measure the relationships that are assumed to govern its behavior. Crucially, our approach does not rely on model performance on holdout samples.
This piece was prompted by both Olaf’s question and a recent article by my friend Neil Raden on his Silicon Angle blog, Performance management: Can you really manage what you measure? It is hard to account for such tweaking in measurement systems. Some relate to inherent issues with what is being measured. million.
It is important that we can measure the effect of these offline conversions as well. Panel studies make it possible to measure user behavior along with the exposure to ads and other online elements. Let's take a look at larger groups of individuals whose aggregate behavior we can measure. days or weeks).
All you need to know, for now, is that machine learning is a field of artificial intelligence that uses statistical techniques to give computer systems the ability to learn based on data by being trained on past examples. These measurement-obsessed companies have an advantage when it comes to AI.
LLMs like ChatGPT are trained on massive amounts of text data, allowing them to recognize patterns and statistical relationships within language. The AGI would need to handle uncertainty and make decisions with incomplete information. NLP techniques help them parse the nuances of human language, including grammar, syntax and context.
Typically, causal inference in data science is framed in probabilistic terms, where there is statisticaluncertainty in the outcomes as well as model uncertainty about the true causal mechanism connecting inputs and outputs. 2009, " Measuring invariances in deep networks ". CoRR, 2016. [3] Goodfellow, Quoc V.
Note also that this account does not involve ambiguity due to statisticaluncertainty. As you can see from the tiny confidence intervals on the graphs, big data ensured that measurements, even in the finest slices, were precise. We addressed #1 with an observational study and #2 with a randomized experiment, as follows.
Because of this trifecta of errors, we need dynamic models that quantify the uncertainty inherent in our financial estimates and predictions. Practitioners in all social sciences, especially financial economics, use confidence intervals to quantify the uncertainty in their estimates and predictions.
E ven after we account for disagreement, human ratings may not measure exactly what we want to measure. Researchers and practitioners have been using human-labeled data for many years, trying to understand all sorts of abstract concepts that we could not measure otherwise. That’s the focus of this blog post.
Unlike experimentation in some other areas, LSOS experiments present a surprising challenge to statisticians — even though we operate in the realm of “big data”, the statisticaluncertainty in our experiments can be substantial. We must therefore maintain statistical rigor in quantifying experimental uncertainty.
On the other hand, fledgling products often have neither the statistical power to identify the effects of small incremental changes, nor the luxury to contemplate small improvements. The metrics to measure the impact of the change might not yet be established. If so, decision making is further simplified.
The genre uniqueness is a measure of how unique a movie’s combination of genre categories is relative to all movies in my data set. I trained 500 models on these 500 random subsamples and built a distribution of ROI values from which I can extract summary statistics such as the median and 95% confidence interval.
In this post we explore why some standard statistical techniques to reduce variance are often ineffective in this “data-rich, information-poor” realm. Despite a very large number of experimental units, the experiments conducted by LSOS cannot presume statistical significance of all effects they deem practically significant.
1) What Is A Misleading Statistic? 2) Are Statistics Reliable? 3) Misleading Statistics Examples In Real Life. 4) How Can Statistics Be Misleading. 5) How To Avoid & Identify The Misuse Of Statistics? If all this is true, what is the problem with statistics? What Is A Misleading Statistic?
16) Interactive Visualization Of The Exponential Spread Of COVID-19 **click image for source** The COVID-19 pandemic paralyzed the entire world with fear and uncertainty, probably more than any other event we’ve experienced in the past few decades. The ESA’s Hipparcos was the first space astrometry mission, which operated from 1898 to 1993.
This role has several explicit requirements including statistical expertise, programming/ML, communication, data analysis/intuition. Focusing narrowly on the first of these, the description currently states that candidates will bring scientific rigor and statistical methods to the challenges of product creation.
Heres a common scene from my consulting work: AI TEAM Heres our agent architectureweve got RAG here, a router there, and were using this new framework for ME [Holding up my hand to pause the enthusiastic tech lead] Can you show me how youre measuring if any of this actually works? Instead, they obsess over measurement and iteration.
We know, statistically, that doubling down on an 11 is a good (and common) strategy in blackjack. But when making a decision under uncertainty about the future, two things dictate the outcome: (1) the quality of the decision and (2) chance. Mike had made the common error of equating a bad outcome with a bad decision.
We organize all of the trending information in your field so you don't have to. Join 42,000+ users and stay up to date on the latest articles your peers are reading.
You know about us, now we want to get to know you!
Let's personalize your content
Let's get even more personalized
We recognize your account from another site in our network, please click 'Send Email' below to continue with verifying your account and setting a password.


Let's personalize your content