This site uses cookies to improve your experience. To help us insure we adhere to various privacy regulations, please select your country/region of residence. If you do not select a country, we will assume you are from the United States. Select your Cookie Settings or view our Privacy Policy and Terms of Use.
Cookie Settings
Cookies and similar technologies are used on this website for proper function of the website, for tracking performance analytics and for marketing purposes. We and some of our third-party providers may use cookie data for various purposes. Please review the cookie settings below and choose your preference.
Used for the proper function of the website
Used for monitoring website traffic and interactions
Cookie Settings
Cookies and similar technologies are used on this website for proper function of the website, for tracking performance analytics and for marketing purposes. We and some of our third-party providers may use cookie data for various purposes. Please review the cookie settings below and choose your preference.
Strictly Necessary: Used for the proper function of the website
Performance/Analytics: Used for monitoring website traffic and interactions
In October, the league, with partner SAP, launched NHL Venue Metrics, a sustainability platform that teams and their venue partners can use for data collection, validation, and reporting and insights. Mitchell says the league is thinking of NHL Venue Metrics in the same way. “We SAP is the technical lead on NHL Venue Metrics.
Amazon Kinesis Data Analytics for SQL is a data stream processing engine that helps you run your own SQL code against streaming sources to perform time series analytics, feed real-time dashboards, and create real-time metrics. AWS has made the decision to discontinue Kinesis Data Analytics for SQL, effective January 27, 2026.
Taiwan holds over $100 billion in assets and decades of experience in semiconductor manufacturing, while the US is still catching up in terms of resources and governance needed to recreate the infrastructure required to support production, said Hyoun Park, CEO and chief analyst at Amalgam Insights.
The haphazard results may be entertaining, although not quite based in fact. While RAG leverages nearest neighbor metrics based on the relative similarity of texts, graphs allow for better recall of less intuitive connections. RAG provides a way to “ground” answers within a selected set of content.
Metrics should include system downtime and reliability, security incidents, incident response times, data quality issues and system performance. Metrics should include system downtime and reliability, security incidents, incident response times, data quality issues and system performance. Pull in the same direction Dont wait.
Organizations can also further utilize the data to define metrics and set goals. Kaushik’s biggest, and most entertaining, rule is “don’t data puke.” They track performance metrics against enterprise-wide strategic goals. Operational metrics dashboards usually end up in the hands of the subject matter experts.
Based on 50 real-life business intelligence examples and case studies, this book is wonderfully crafted, incredibly entertaining, insightful, enlightening, intriguing, and result-driven. One of Bernard Marr’s best offerings to date, this truly is one of the best books for data science in existence today – a must-read in today’s world.
These will be across a number of sectors including marketing, publishing, entertainment, and education in both B2C and B2B environments. This year we saw online education giant Chegg lose 99% of its market value, or $14.5 billion, after students switched to ChatGPT free help for homework, rather than pay $19.95
Recent cyberattacks at MGM Resorts and Caesars Entertainment have put the spotlight on cybersecurity practices at casinos – and the importance of educating employees on social engineering tactics. What’s on your data dashboard as the most important metrics? Events, Media and Entertainment Industry, Security
Another is to recreate real-life situations (gamification) where people are brought into play games to observe the decisions and understand their emotional state. Measure user adoption and engagement metrics to not just understand products take-up, but also to enhance the overall product propositions.
YouTube has democratized entertainment and education. Success Metrics. In my Oct 2011 post, Best Social Media Metrics , I'd created four metrics to quantify this value. I believe the best way to measure success is to measure the above four metrics (actual interaction/action/outcome). The benefits are numerous.
Lastly, the system needs to keep track of the number of records in each file, the time it takes to create the output, the time it takes to process, the number of errors created per output test file by the 12 different test types, the number of errors correctly captured by the automated tests and other business-specific metrics.
One of the keys for our success was really focusing that effort on what our key business initiatives were and what sorts of metrics mattered most to our customers. Chapin also mentioned that measuring cycle time and benchmarking metrics upfront was absolutely critical. “It GE formed its Digital League to create a data culture.
b] The workflow, using AWS Lambda , checks Amazon CloudWatch in the primary Region for the SchedulerHeartbeat metrics of the primary Amazon MWAA environment. b] The workflow, using AWS Lambda , checks Amazon CloudWatch in the primary Region for the SchedulerHeartbeat metrics of the primary Amazon MWAA environment. c] Skipped [2.d]
and metrics (follows, likes, reach, growth, awareness, post performance, engagements, etc.) Depending on the specific use-case and what kind of metrics you want to track, the reporting process for various social channels will be different. Choose the right metrics. What Is A Social Media Report? over various time frames.
The metrics are collected from one or more items on a network. You might look at specific interactions and recreate them so you can know what leads up to an issue. You’ll want to consider metrics when coming up with a solution. If the metrics change, there might be a problem.
There are several video content types available to pick from such as brand videos, demo videos, promo videos, educational videos, expert interviews, entertaining videos, etc. You may mix up entertaining and educational approaches, create product demonstrations that connect with your business or try any other combo. Click-through rate.
It shows the aggregate metrics of the files that have been processed by a auto-copy job. Delete and recreate your auto-copy job if you want to reset file tracking history and start over. For example, this is helpful in scenarios where you don’t have control of the file name and the initial file received failed.
Furthermore, when an issue arises, such as a node becoming unresponsive, OpenSearch Service recovers by recreating the missing shards (data), causing a potentially large movement of data in the domain. When you use Multi-AZ with Standby, OpenSearch Service doesn’t need to redistribute or recreate data from missing nodes.
Using the Migration Assistant solution , we created a snapshot of the source cluster, stored it in S3, and performed a metadata migration so that the indices on the source were recreated on the target cluster with the same shard and replica counts. The migration was completed in approximately 35 minutes.
These forecasts are then combined with planning scenarios and metrics such as occupancy, daily attrition, and full-time equivalent (FTE) hours per week to help with staffing, the company said, adding that the capacity planning feature helps predict the number of agents required to meet service level targets for a certain period of time.
Tooltips (showing more related metrics or visuals upon mouseover of a specific data point) is a feature of both Tableau and Power BI, but they are accessed and configured very differently in both programs. Create, don’t recreate. Differences between data systems additionally mean that trying to recreate your old data resources (e.g.
How do you track and report the impact of these metrics on key business outcomes? Similarly, impact of cost dimensions, compensation and benefits, training, travel, social security, recruitment, and entertainment cost. Headcount, attrition hires, promotions cost, time to hire, retirement rate, critical talent and variable pay.
Specific metrics can vary from platform to platform. When that messaging is perfect, it strikes the right tone, speaking to their most important needs while also entertaining and educating. However, the following social data points are common to all of them: Shares/reposts Likes Comments Mentions Impressions Conversions Clicks.
A wider world of IT partners “We are witnessing a paradigm shift where enterprises are not just increasing their number of partnerships but also diversifying the types of partners they work with,” says Harshul Asnani , president of technology, media, and entertainment at Tech Mahindra. Double down on vendor management.
Both utilities unload the performance metrics from the replay of the source workload on the target configuration(s) to Amazon Simple Storage Service (Amazon S3), which is used as a storage to store the performance metrics. The following image shows the process flow. Grant usage on the schema for any relevant users.
However, altering schema and table partitions in traditional data lakes can be a disruptive and time-consuming task, requiring renaming or recreating entire tables and reprocessing large datasets. This hampers agility and time to insight. Each snapshot is a complete set of data files in the table at a point in time.
AWS Glue Data Quality is built on DeeQu , an open source tool developed and used at Amazon to calculate data quality metrics and verify data quality constraints and changes in the data distribution so you can focus on describing how data should look instead of implementing algorithms.
If you choose not to use a cloud provider’s native services in order to remain agnostic, you lose many of the ‘better, cheaper, faster’ business case metrics,” says Holcombe. that make migration to another platform difficult due to the complexity of recreating all of that on a new platform.
The industries these decision-makers represented include insurance, banking, healthcare and life sciences, government, entertainment, and energy in the U.S. The listening centered on conversations about emerging technologies and use cases associated with innovation, such as artificial intelligence, metaverse, blockchain, robotics, Web 3.0,
We’ve all experience the complex charts with multiple variables and screens full of metrics. I think you’ll find it entertaining and worth consideration if you are in the business of communicating data. If not comfortable with the basics, it can be too much. It can also be rewarding. Enjoy the video.
Despite nearly $1 billion in online revenue in 2020, the web-based outdoor recreational retailer was running its entire business on an outdated and unsupported e-commerce platform called ADT. It got the basic job done but the company’s executive leadership team (ELT) knew it was time for a transformation. But tech was in the total doldrums.”.
Alation is pleased to be named a dbt Metrics Partner and to announce the start of a partnership with dbt, which will bring dbt data into the Alation data catalog. Taking this a step further, this same data can also be transformed to generate business metrics. But what if you could combine that information with usage metrics?
Our goal is to analyze logs and metrics, connecting them with the source code to gain insights into code fixes, vulnerabilities, performance issues, and security concerns,” he says. Hughes has already completed a successful proof of concept (PoC) for these use cases and is now developing them into a product.
Some will argue that observability is nothing more than testing and monitoring applications using tests, metrics, logs, and other artifacts. The water cooler arguments over tool superiority are always entertaining, but will never be settled. A more observable system enables you to more easily pinpoint the source of an issue.
We need to avoid recreating pipelines in JavaScript and training service queues. Time to restoration of service is also an important metric to estimate with AI & ML. We will see more mobile, browser, and embedded devices with resource-efficient models and on-device training with privacy and security.
It’s not possible to increase the primary shard number of an existing index, meaning an index must be recreated if you want to increase the primary shard count. Check the disk.avail metric for hot storage tier nodes to validate your available disk space. The _reindex operation is resource intensive.
Your experience of entertainment is entirely different based on the context you bring. Is there a structure or framework that undergirds your choice of metrics? For a new viewer , it is a courtroom confession in costume. It makes a world of different to know: Why we are here in this room? Who are these characters?
One method to ensure this is by sourcing primarily recycled materials, like Patagonia does in the production of its outdoor recreation clothing. Here are some common steps to building your own process: Goal setting : Identify specific goals and metrics like cutting costs, improving quality control or better managing supplier risk.
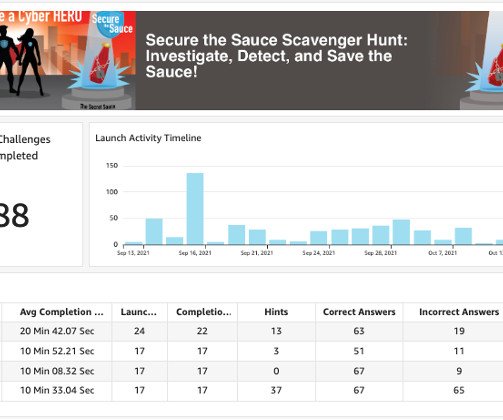
Not only do organizations have to conduct security awareness training programs, but they also need insights into data and metrics that identify points of weakness to take data-driven corrective courses of action. The program itself focuses on driving engagement through an entertaining storyline with creative visuals.
Model performance metrics together with input features, predictions and potentially ground truth values, can be tracked over time. Model reproducibility is the extent to which a model can be recreated. This might require making batch and individual predictions. Machine Learning Model Reproducibility .
It also cuts carbon emissions by roughly 150 metric tons per year. Re-imagined customer experience example: Camping World The COVID-19 pandemic caused an unprecedented number of customers for Camping World , the leading retailer of recreational vehicles (RVs), revealing some issues with their existing infrastructure.
This phase of planning also covers projected project milestones and well-defined metrics for the system once it goes live. During this phase, both the IT team and the project team should be monitoring the system’s performance along with the key metrics identified in the planning stage.
For example, when making routine work analysis reports, we find it is inconvenient to re-summarize the latest data and recreate a new report, especially when the data is in a large volume. For example, the following financial report sample contains some commonly used metrics for financial analysis. Data and KPIs are ready.
We organize all of the trending information in your field so you don't have to. Join 42,000+ users and stay up to date on the latest articles your peers are reading.
You know about us, now we want to get to know you!
Let's personalize your content
Let's get even more personalized
We recognize your account from another site in our network, please click 'Send Email' below to continue with verifying your account and setting a password.


Let's personalize your content