This site uses cookies to improve your experience. To help us insure we adhere to various privacy regulations, please select your country/region of residence. If you do not select a country, we will assume you are from the United States. Select your Cookie Settings or view our Privacy Policy and Terms of Use.
Cookie Settings
Cookies and similar technologies are used on this website for proper function of the website, for tracking performance analytics and for marketing purposes. We and some of our third-party providers may use cookie data for various purposes. Please review the cookie settings below and choose your preference.
Used for the proper function of the website
Used for monitoring website traffic and interactions
Cookie Settings
Cookies and similar technologies are used on this website for proper function of the website, for tracking performance analytics and for marketing purposes. We and some of our third-party providers may use cookie data for various purposes. Please review the cookie settings below and choose your preference.
Strictly Necessary: Used for the proper function of the website
Performance/Analytics: Used for monitoring website traffic and interactions
Using daily and/or weekly salesreports with your team may be the single most powerful action you can take to increase your team’s performance. And not just that, we will discuss the purpose and creation process so that you find out exactly what’s the story behind each report. What Is A SalesReport?
By establishing clear operational metrics and evaluate performance, companies have the advantage of using what is crucial to stay competitive in the market, and that’s data. Your Chance: Want to visualize & track operational metrics with ease? Try our professional reporting software for 14 days, completely free!
At the same time, inventory metrics are needed to help managers and professionals in reaching established goals, optimizing processes, and increasing business value. We will finish by presenting a business dashboard that will show how those metrics work together when depicting an inventory data-story. What Are Inventory Metrics?
Not only are you responsible for the ongoing financial strategy of your organization, but you’re probably expected to provide timely, accurate reports to a variety of stakeholders. CFO reports supercharge your financial initiatives. Benefit from great CFO dashboards & reports! What Is A CFO Report?
As a business, you need the reliability of frequent financial reports to gain a better grasp of your financial status, both current and future. A robust finance report communicates crucial financial information that covers a specified period through daily, weekly, and monthly financial reports. What Is A Finance Report?
An important part of a successful business strategy is utilizing a modern data analysis tool and implementing a marketing report in its core procedures that will become the beating heart of acquiring customers, researching the market, providing detailed data insights into the most valuable information for any business: is our performance on track?
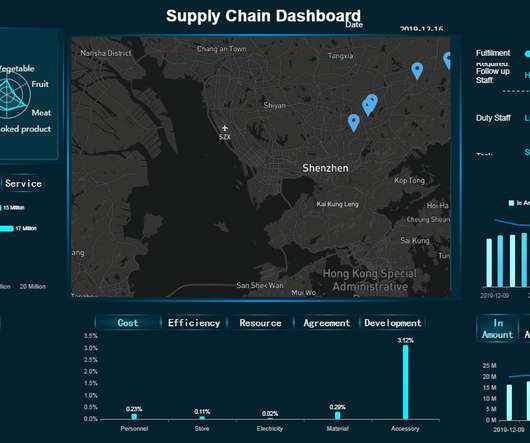
That’s why it’s critical to monitor and optimize relevant supply chain metrics. Finally, we will show how to combine those metrics with the help of modern KPI software and create professional supply chain dashboards. Your Chance: Want to visualize & track supply chain metrics with ease? Cash-to-cash Time Cycle.
In your daily business, many different aspects and ‘activities’ are constantly changing – sales trends and volume, marketing performance metrics, warehouse operational shifts, or inventory management changes. And business report templates are the best help for that. Benefit from great business reports today!
1) What Are Productivity Metrics? 3) Productivity Metrics Examples. 4) The Value Of Workforce Productivity Metrics. Productivity can be measured in many different ways and at different levels, from the raw industrial output of an asset in a manufacturing facility to the specific individual sales performance of a vendor.
Management reporting is a source of business intelligence that helps business leaders make more accurate, data-driven decisions. But, these reports are only as useful as the work that goes into preparing and presenting them. By the end of this article, making stunning and useful managerial reports will be second nature to you.
In recent years, analytical reporting has evolved into one of the world’s most important business intelligence components, compelling companies to adapt their strategies based on powerful data-driven insights. What Is An Analytical Report? Your Chance: Want to build your own analytical reports completely free? Let’s get started.
According to AI at Wartons report on navigating gen AIs early years, 72% of enterprises predict gen AI budget growth over the next 12 months but slower increases over the next two to five years. CIOs should return to basics, zero in on metrics that will improve through gen AI investments, and estimate targets and timeframes.
Big data plays a crucial role in online data analysis , business information, and intelligent reporting. That’s where business intelligence reporting comes into play – and, indeed, is proving pivotal in empowering organizations to collect data effectively and transform insight into action. What Is BI Reporting?
To put the power of CRM software (or customer relationship management dashboard software) into a living, breathing, real-world perspective, we’ll explore CRM dashboards in more detail, starting with basic definitions of such dashboards and reports while considering how you can use CRM dashboard software to your business-boosting advantage.
1) What Is A Monthly Report? 2) What Is The Purpose Of Monthly Reporting? 3) Monthly Report Templates & Examples. 4) What Does A Monthly Report Contain? Your Chance: Want to test modern reporting software for free? Explore our 14-day free trial & benefit from great reports today! Table of Contents.
1) What Is A Weekly Report? 2) Why Are Weekly Progress Reports Important? 3) Weekly Report Templates & Examples. 4) Top Elements Of A Weekly Performance Report. This is where interactive weekly reports come into the picture. Your Chance: Want to build great weekly status reports on your own?
Moreover, within just five years, the number of smart connected devices in the world will amount to more than 22 billion – all of which will produce colossal sets of collectible, curatable, and analyzable data, claimed IoT Analytics in their industry report. One of the most effective means of doing this is by utilizing KPI reporting tools.
With the rate of available data growing exponentially, it’s crucial to work with the right online reporting tools to not only segment, curate, and analyze large data sets but also uncover answers to new questions that you didn’t even know existed. Your Chance: Want to benefit from modern ad hoc reporting?
As the head of sales at your small company, you’ve prepared for this moment. “Mr. Download our free executive summary and boost your sales strategy! That’s why, in this post, we’re going to go over 16 sales graphs and charts that will fuel your imagination and give you some useful resources. 1) Sales Performance.
This intermediate layer strikes a balance by refining data enough to be useful for general analytics and reporting while still retaining flexibility for further transformations in the Gold layer. At the same time, the Gold layer’s “single version of the truth” makes data accessible and reliable for reporting and analytics.
2) What Are Metrics? 3) KPIs vs Metrics: Main Differences. 4) Tips For KPI & Metrics Tracking. This is done with the help of KPI and metrics. KPIs and metrics are often considered the same thing in day-to-day business contexts. Let’s quick it off with the definition of metrics and KPIs! What Are Metrics?
That’s where recruitment metrics come in. By utilizing recruiting KPIs presented through the medium of visual and interactive HR dashboards , it’s possible to use recruitment metrics to better interpret and evaluate a variety of talent acquisition factors that aid in hiring processes. What You Can Learn From Recruitment Metrics.
We won’t delve into details about the career prospects of this C-level position but we will present COO dashboards and reports that are critical for helping chief operating officers across the world to effectively manage their time, company, operational processes, and results. What is a COO report? What Is A COO Report?
To squeeze every last drop of value from your data, both in an operational and strategic sense, it’s important to leverage the right online reporting tool. When it comes to reporting, the daily running of your business, the plans and methods you formulate to improve the organization will steer your long-term success. Let’s begin.
Table of Contents 1) What Is The Report Definition? 2) Top 14 Types Of Reports 3) What Does A Report Look Like? Businesses have been producing reports since, forever. This presents a problem for many modern organizations today as building reports can take from hours to days. What Is The Report Definition?
there are two answers that go hand in hand: good exploitation of your analytics, that come from the results of a market research report. Your Chance: Want to test a market research reporting software? Explore our 14 day free trial & benefit from market research reports! What Is A Market Research Report?
One of the world’s most popular cloud-based customer relationship management (CRM) platforms, the software is designed to help companies across sectors plan and optimize their sales processes. First, let’s take a moment to understand the role of Salesforce reports in the business world. What Is A Salesforce Report?
6) Data Quality Metrics Examples. Reporting being part of an effective DQM, we will also go through some data quality metrics examples you can use to assess your efforts in the matter. It involves: Reviewing data in detail Comparing and contrasting the data to its own metadata Running statistical models Data quality reports.
An Operations Key Performance Indicator (KPI) or metric is a discrete measurement that a company uses to monitor and evaluate the efficiency of its day-to-day operations. Why Your Company Should Be Using Operational Metrics to Stay Competitive. If they aren’t, it won’t be a business for very long.
Table of Contents 1) What Is A Performance Report? 2) The Importance of Performance Reports 3) Performance Report Examples 4) Performance Reporting Tips Performance reporting has been a traditional business practice for decades now. At the time, this was not an issue, as the static nature of reporting was the norm.
By gaining the ability to gather, organize and analyze the metrics that are most important to your organization, you stand to make your business empire more intelligent than ever before – and executive reporting and business dashboards will help you do just that. Exclusive Bonus Content: Executive Dashboards & Reports: A Summary.
Almost all metrics you currently use have one common thread: They are almost all backward-looking. If you want to deepen the influence of data in your organization – and your personal influence – 30% of your analytics efforts should be centered around the use of forward-looking metrics. Predictive metrics!
Table of Contents 1) What Are White Label Reports? 2) Benefits Of White Label Reports 3) Key White Label Reporting Features 4) White Label Dashboards & Report Examples In today’s competitive business environment, building a brand that is trusted, recognizable, and loved by many is not an easy task.
1) What Is Content Reporting? 3) Why Is Content Report Analysis Important? 5) Content Reporting Best Practices. Enter modern content reports. What Is Content Reporting? This is no longer the case, thanks to the introduction of modern reporting tools such as interactive dashboards. Table of Contents.
Getting your socially-driven affairs in order can seem like an impossible feat, but with social media reporting, you will be able to gain the insights you need to attain the results you deserve. When you add up modern technology and a professional report tool , your reporting processes in the social realm will reap many rewards.
As a CEO, you’re responsible for overseeing every aspect of your business, from the people and the internal culture all the way through to key sales, marketing, and financial strategies. CEO dashboards and CEO reports are the answer. Let’s explore by looking at the core information you should include in your CEO dashboard reports: 1.
1) What Are Accounting Reports? 2) Why Do You Need Accounting Reports? 3) Types Of Accounting Reports. 4) Accounting Reports Examples. 5) The Role Of Visuals In Accountant Reports. On the basis of every company’s competent management, we can find accounting reports. What Are Accounting Reports?
Standard reports stink. Custom reports rock! Why would a report created for everyone work for the special someone that you are? Custom reports allow you to deeply focus (by eliminating the rif-raf metrics and dimensions, they save time and show just what you want). Key Metrics: Map Overlay Visualization.
Well-built, focused dashboards easily serve up summaries and reports of the BI that’s most critical to the organization. Organizations can also further utilize the data to define metrics and set goals. The sales performance dashboard above is a one-stop-shop for sales insights. It also needs to deliver context!
A real estate Key Performance Indicator (KPI) or metric is a quantifiable measure used to assess the performance of a business in the real estate industry. These performance metrics can be used to analyze several different business segments from individual realtor performance to investment property potential. Is it worth your time?
3) The Role Of Data Drilling In Reporting. 4) Drill Down & Drill Through Reporting Examples. From automated reporting, predictive analytics, and interactive data visualizations, reporting on data has never been easier. Your Chance: Want to start building your own interactive reports today? Table of Contents.
The importance of procurement reports is becoming more and more prominent. Here, we introduce the definition and importance of purchase reports and provide templates and guidelines to inform you how to write an appropriate purchase report. What Is a Procurement Report? Purchasing Reports Samples. Free Download.
A financial Key Performance Indicator (KPI) or metric is a quantifiable measure that a company uses to gauge its financial performance over time. Under modern day reporting standards, companies are formally obligated to present their financial data in the following statements: balance sheet, income statement, and cash flow statement.
IT leaders are drowning in metrics, with many finding themselves up to their KPIs in a seemingly bottomless pool of measurement tools. There are several important metrics that can be used to achieve IT success, says Jonathan Nikols, senior vice president of global enterprise sales for the Americas at Verizon. Here they are.
We organize all of the trending information in your field so you don't have to. Join 42,000+ users and stay up to date on the latest articles your peers are reading.
You know about us, now we want to get to know you!
Let's personalize your content
Let's get even more personalized
We recognize your account from another site in our network, please click 'Send Email' below to continue with verifying your account and setting a password.


Let's personalize your content