This site uses cookies to improve your experience. To help us insure we adhere to various privacy regulations, please select your country/region of residence. If you do not select a country, we will assume you are from the United States. Select your Cookie Settings or view our Privacy Policy and Terms of Use.
Cookie Settings
Cookies and similar technologies are used on this website for proper function of the website, for tracking performance analytics and for marketing purposes. We and some of our third-party providers may use cookie data for various purposes. Please review the cookie settings below and choose your preference.
Used for the proper function of the website
Used for monitoring website traffic and interactions
Cookie Settings
Cookies and similar technologies are used on this website for proper function of the website, for tracking performance analytics and for marketing purposes. We and some of our third-party providers may use cookie data for various purposes. Please review the cookie settings below and choose your preference.
Strictly Necessary: Used for the proper function of the website
Performance/Analytics: Used for monitoring website traffic and interactions
A Tour of Evaluation Metrics for Machine Learning After we train our. The post A Tour of Evaluation Metrics for Machine Learning appeared first on Analytics Vidhya. This article was published as a part of the Data Science Blogathon.
This powerful metric, called relative entropy or information gain, has become indispensable in various fields, from statistical inference to deep learning.
This article was published as a part of the Data Science Blogathon Introduction Before explaining the correlation and correlation metrics, I would like you to answer a simple question. The post Different Type of Correlation Metrics Used by Data Scientists appeared first on Analytics Vidhya.
The post HOW TO CHOOSE EVALUATION METRICS FOR CLASSIFICATION MODEL appeared first on Analytics Vidhya. This article was published as a part of the Data Science Blogathon. INTRODUCTION Yay!! So you have successfully built your classification model. What should.
Examining five years of anonymous data from over 6 million users in 170+ countries, Spigit has discovered that a culture of innovation can be measured – with a 99% statistical confidence level – by a metric called "ideation rate." Download the eBook now for an in-depth look at this groundbreaking study.
Overview Evaluating a model is a core part of building an effective machine learning model There are several evaluation metrics, like confusion matrix, cross-validation, The post 11 Important Model Evaluation Metrics for Machine Learning Everyone should know appeared first on Analytics Vidhya.
The post Quick Guide to Evaluation Metrics for Supervised and Unsupervised Machine Learning appeared first on Analytics Vidhya. This article was published as a part of the Data Science Blogathon. Introduction Machine learning is about building a predictive model using historical data.
ArticleVideo Book This article was published as a part of the Data Science Blogathon Evaluation Metrics for Classification Problem Image source ?[link] The post Metrics to Evaluate your Classification Model to take the right decisions appeared first on Analytics Vidhya. link] Abstract The most.
Unlike traditional AUC scores, partial AUC scores concentrate on a specific region of the ROC (Receiver Operating Characteristic) curve, offering a more detailed evaluation of the model’s […] The post Partial AUC Scores: A Better Metric for Binary Classification appeared first on Analytics Vidhya.
Introduction Click-through Rate (CTR) is a crucial metric that shows the percentage of visitors who click on an ad, providing insights into ad effectiveness. Businesses might considerably benefit from studying the click-through rate when developing their advertising tactics.
6) Data Quality Metrics Examples. Reporting being part of an effective DQM, we will also go through some data quality metrics examples you can use to assess your efforts in the matter. It involves: Reviewing data in detail Comparing and contrasting the data to its own metadata Running statistical models Data quality reports.
Similarly, downstream business metrics in the Gold layer may appear skewed due to missing segments, which can impact high-stakes decisions. An operation to merge customer data across multiple sources might incorrectly aggregate records due to mismatched keys, leading to inflated or deflated metrics in the Silver layer.
Turnover rates have taken center stage in workforce discussions, often being the first metric leaders request when assessing the state of the workforce. As leaders, we often report a series of metrics out of habitcost per hire sounds strategic, but it doesnt often lead to insights about long-term performance or retention.
Mark Twain famously remarked that there are three kinds of lies: lies, damned lies, and statistics. Today, many CIOs feel the same way about metrics. Metrics are only as good as their source. Therefore, CIOs must be cautious about taking metrics at face value [and] leaders need to understand the data behind the metrics.”.
While RAG leverages nearest neighbor metrics based on the relative similarity of texts, graphs allow for better recall of less intuitive connections. As a result, GraphRAG mixes two bodies of “AI” research: the more symbolic reasoning which knowledge graphs represent and the more statistical approaches of machine learning.
Learning from visitor behaviors and using statistics requires a balance between understanding data and understanding marketing. This metric identifies when someone only views one page of your website before navigating away. The next important metric to pay attention to are your traffic sources. Exit Pages. Traffic Sources.
They need to stop sending cold emails until they have good metrics. However, you need to make sure that you use the right metrics in your email marketing campaigns. Reliable and accurate statistics are essential to cold emailing campaigns. In addition, there are four important metrics in particular that you need to be using.
1) What Are Product Metrics? 2) Types Of Product Metrics. 3) Product Metrics Examples You Can Use. 4) Product Metrics Framework. The right product performance metrics will give you invaluable insights into its health, strength and weaknesses, potential issues or bottlenecks, and let you improve it greatly.
Today we are pleased to announce a new class of Amazon CloudWatch metrics reported with your pipelines built on top of AWS Glue for Apache Spark jobs. The new metrics provide aggregate and fine-grained insights into the health and operations of your job runs and the data being processed. workerUtilization showed 1.0
Key Success Metrics, Benefits, and Results for Data Observability Using DataKitchen Software Lowering Serious Production Errors Key Benefit Errors in production can come from many sources – poor data, problems in the production process, being late, or infrastructure problems. DataKitchen Customer Quotes “.
Data analysis method focuses on strategic approaches to taking raw data, mining for insights that are relevant to the business’s primary goals, and drilling down into this information to transform metrics, facts, and figures into initiatives that benefit improvement. Conduct statistical analysis. Visualize your data.
Read here how these metrics can drive your customers’ satisfaction up! Customer satisfaction metrics evaluate how the products or services supplied by a company meet or surpass a customer’s expectations. These metrics are crucial to any business’s long-term success. Top 3 Customer Satisfaction Metrics.
There are also many important considerations that go beyond optimizing a statistical or quantitative metric. As we deploy ML in many real-world contexts, optimizing statistical or business metics alone will not suffice. Models will need to be customized (for specific locations, cultural settings, domains, and applications).
A data scientist must be skilled in many arts: math and statistics, computer science, and domain knowledge. Statistics and programming go hand in hand. Mastering statistical techniques and knowing how to implement them via a programming language are essential building blocks for advanced analytics. Linear regression.
All you need to know for now is that machine learning uses statistical techniques to give computer systems the ability to “learn” by being trained on existing data. Even with good training data and a clear objective metric, it can be difficult to reach accuracy levels sufficient to satisfy end users or upper management.
Amazon Redshift provides performance metrics and data so you can track the health and performance of your provisioned clusters, serverless workgroups, and databases. This feature is part of the Amazon Redshift console and provides a visual and graphical representation of the query’s run order, execution plan, and various statistics.
Standard Deviation is one of the most underrated statistical tools out there. It’s an extremely useful metric that most people know how to calculate but very few know how to use effectively.
A financial Key Performance Indicator (KPI) or metric is a quantifiable measure that a company uses to gauge its financial performance over time. These three statements are data rich and full of financial metrics. The Fundamental Finance KPIs and Metrics – Cash Flow. What is a Financial KPI? Current Ratio. View Guide Now.
The company is looking for an efficient, scalable, and cost-effective solution to collecting and ingesting data from ServiceNow, ensuring continuous near real-time replication, automated availability of new data attributes, robust monitoring capabilities to track data load statistics, and reliable data lake foundation supporting data versioning.
But often that’s how we present statistics: we just show the notes, we don’t play the music.” – Hans Rosling, Swedish statistician. But if the same insights or metrics are presented in a simple graph, the number rises to 97%. 14) “Visualize This: The Flowing Data Guide to Design, Visualization, and Statistics” by Nathan Yau.
While analytical reporting is based on statistics, historical data and can deliver a predictive analysis of a specific issue, its usage is also spread in analyzing current data in a wide range of industries. For example, a hospital has seen in their report that the average waiting time can be reduced by conducting specific actions.
It’s important for business users to be able to see quality scores and metrics to make confident business decisions and debug data quality issues. It provides insights and metrics related to the performance and effectiveness of data quality processes. We can analyze the data quality score and metrics using Athena SQL queries.
No precalculated statistics were used for these tables. The following table summarizes the metrics. Metric Amazon EMR 7.5 Metric Amazon EMR 7.5 times better Baseline In addition to the time-based metrics discussed so far, data from Spark event logs show that Amazon EMR scanned approximately 3.4 Metric Amazon EMR 7.5
While some experts try to underline that BA focuses, also, on predictive modeling and advanced statistics to evaluate what will happen in the future, BI is more focused on the present moment of data, making the decision based on current insights. But let’s see in more detail what experts say and how can we connect and differentiate the both.
To counter such statistics, CIOs say they and their C-suite colleagues are devising more thoughtful strategies. And the Global AI Assessment (AIA) 2024 report from Kearney found that only 4% of the 1,000-plus executives it surveyed would qualify as leaders in AI and analytics. As part of that, theyre asking tough questions about their plans.
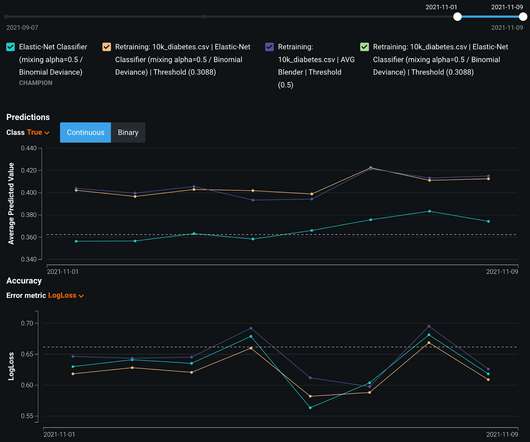
This also shows how the models compare on standard performance metrics and informative visualizations like Dual Lift. With DataRobot AI Cloud, you can see predicted values and accuracy for various metrics for the Champion as well as any Challenger models.]. Model Observability with Custom Metrics.
While sometimes it’s okay to follow your instincts, the vast majority of your business-based decisions should be backed by metrics, facts, or figures related to your aims, goals, or initiatives that can ensure a stable backbone to your management reports and business operations. Quantitative data analysis focuses on numbers and statistics.
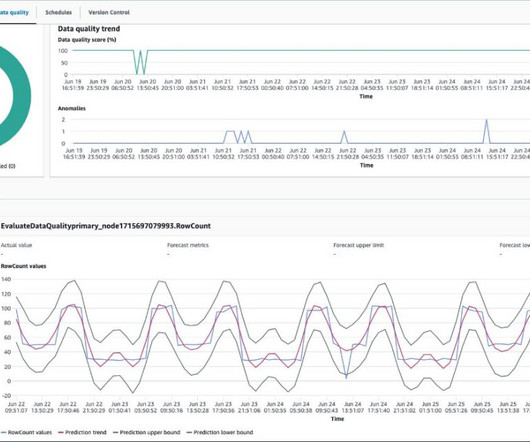
Run the job for 6 days and explore how AWS Glue Data Quality learns from data statistics and detects anomalies. For Statistics , enter RowCount. For Statistics , enter DistinctValuesCount and for Columns , enter pulocationid. Rules and analyzers gather data statistics or data profiles. Add a second analyzer.
According to the US Bureau of Labor Statistics, demand for qualified business intelligence analysts and managers is expected to soar to 14% by 2026, with the overall need for data professionals to climb to 28% by the same year. The Bureau of Labor Statistics also states that in 2015, the annual median salary for BI analysts was $81,320.
Picture procurement metrics – you need to know if suppliers fulfill your demands, their capacity to respond to urgent demands, costs of orders, and many other indicators to efficiently track your company’s performance. They are customizable and thus offer a powerful means of drilling down deep into very specific pockets of information.
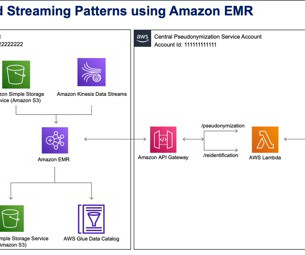
In the following examples, we analyze three important Lambda metrics for the pseudonymization service: Invocations , ConcurrentExecutions , and Duration. The following graph depicts the Invocations metric, with the statistic SUM in orange and RUNNING SUM in blue. The first graph shows the metric in bytes, which peaks 6.8
Business analytics is the practical application of statistical analysis and technologies on business data to identify and anticipate trends and predict business outcomes. Business analytics also involves data mining, statistical analysis, predictive modeling, and the like, but is focused on driving better business decisions.
4) How to Select Your KPIs 5) Avoid These KPI Mistakes 6) How To Choose A KPI Management Solution 7) KPI Management Examples Fact: 100% of statistics strategically placed at the top of blog posts are a direct result of people studying the dynamics of Key Performance Indicators, or KPIs. 3) What Are KPI Best Practices?
We organize all of the trending information in your field so you don't have to. Join 42,000+ users and stay up to date on the latest articles your peers are reading.
You know about us, now we want to get to know you!
Let's personalize your content
Let's get even more personalized
We recognize your account from another site in our network, please click 'Send Email' below to continue with verifying your account and setting a password.


Let's personalize your content