This site uses cookies to improve your experience. To help us insure we adhere to various privacy regulations, please select your country/region of residence. If you do not select a country, we will assume you are from the United States. Select your Cookie Settings or view our Privacy Policy and Terms of Use.
Cookie Settings
Cookies and similar technologies are used on this website for proper function of the website, for tracking performance analytics and for marketing purposes. We and some of our third-party providers may use cookie data for various purposes. Please review the cookie settings below and choose your preference.
Used for the proper function of the website
Used for monitoring website traffic and interactions
Cookie Settings
Cookies and similar technologies are used on this website for proper function of the website, for tracking performance analytics and for marketing purposes. We and some of our third-party providers may use cookie data for various purposes. Please review the cookie settings below and choose your preference.
Strictly Necessary: Used for the proper function of the website
Performance/Analytics: Used for monitoring website traffic and interactions
All you need to know for now is that machine learning uses statistical techniques to give computer systems the ability to “learn” by being trained on existing data. Machine learning adds uncertainty. Underneath this uncertainty lies further uncertainty in the development process itself.
To win in business you need to follow this process: Metrics > Hypothesis > Experiment > Act. We are far too enamored with data collection and reporting the standard metrics we love because others love them because someone else said they were nice so many years ago. That metric is tied to a KPI.
by AMIR NAJMI & MUKUND SUNDARARAJAN Data science is about decision making under uncertainty. Some of that uncertainty is the result of statistical inference, i.e., using a finite sample of observations for estimation. But there are other kinds of uncertainty, at least as important, that are not statistical in nature.
This classification is based on the purpose, horizon, update frequency and uncertainty of the forecast. With those stakes and the long forecast horizon, we do not rely on a single statistical model based on historical trends. These characteristics of the problem drive the forecasting approaches.
In addition, they can use statistical methods, algorithms and machine learning to more easily establish correlations and patterns, and thus make predictions about future developments and scenarios. Most use master data to make daily processes more efficient and to optimize the use of existing resources.
This was not a scientific or statistically robust survey, so the results are not necessarily reliable, but they are interesting and provocative. I recently saw an informal online survey that asked users which types of data (tabular, text, images, or “other”) are being used in their organization’s analytics applications.
Systems should be designed with bias, causality and uncertainty in mind. Uncertainty is a measure of our confidence in the predictions made by a system. We need to understand and provide the greatest human oversight on systems with the greatest levels of uncertainty. System Design. Human Judgement & Oversight. Model Drift.
Of course, any mistakes by the reviewers would propagate to the accuracy of the metrics, and the metrics calculation should take into account human errors. If we could separate bad videos from good videos perfectly, we could simply calculate the metrics directly without sampling. The missing verdicts create two problems.
the weight given to Likes in our video recommendation algorithm) while $Y$ is a vector of outcome measures such as different metrics of user experience (e.g., Crucially, it takes into account the uncertainty inherent in our experiments. Here, $X$ is a vector of tuning parameters that control the system's operating characteristics (e.g.
Pertinence and fidelity of metrics developed from Data. Metrics are seldom reliant on just one data element, but are often rather combinations. There are often compromises to be made in defining metrics. Integrity of statistical estimates based on Data. For example: Is this a good way to define New Business Growth?
Ensure that product managers work on projects that matter to the business and/or are aligned to strategic company metrics. All you need to know, for now, is that machine learning is a field of artificial intelligence that uses statistical techniques to give computer systems the ability to learn based on data by being trained on past examples.
This means it is possible to specify exactly in which geos an ad campaign will be served – and to observe the ad spend and the response metric at the geo level. In other words, iROAS is the slope of a curve of the response metric plotted against the underlying advertising spend. They are non-overlapping geo-targetable regions.
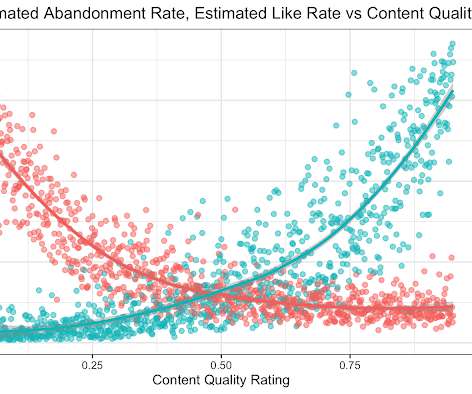
Note also that this account does not involve ambiguity due to statisticaluncertainty. The green and peach lines show metrics for users of the same device, on experiments that left the result fully visible, or moved it up by about the same amount.
Once we’ve answered that, we will then define and use metrics to understand the quality of human-labeled data, along with a measurement framework that we call Cross-replication Reliability or xRR. We will follow the example of Janson and Olsson , and start from this generalized definition of the metric, which they call iota.
Unlike experimentation in some other areas, LSOS experiments present a surprising challenge to statisticians — even though we operate in the realm of “big data”, the statisticaluncertainty in our experiments can be substantial. We must therefore maintain statistical rigor in quantifying experimental uncertainty.
Such decisions involve an actual hypothesis test on specific metrics (e.g. Often, an established product will have an overall evaluation criterion (OEC) that incorporates trade-offs among important metrics and between short- and long-term success. The metrics to measure the impact of the change might not yet be established.
He was saying this doesn’t belong just in statistics. It involved a lot of work with applied math, some depth in statistics and visualization, and also a lot of communication skills. They learned about a lot of process that requires that you get rid of uncertainty. They’re being told they have to embrace uncertainty.
In this post we explore why some standard statistical techniques to reduce variance are often ineffective in this “data-rich, information-poor” realm. Despite a very large number of experimental units, the experiments conducted by LSOS cannot presume statistical significance of all effects they deem practically significant.
Building Models to Predict Movie Profitability Here I use profitability as the metric of success for a film and define profitability as the return on investment (ROI). I used XGBoost as my regression model as I found that it slightly outperforms random forest regression when using the root-mean-square error (RMSE) as the goodness metric.
Not only is each flight color-coded by the airline, but this short movie-style visualization has transformed flight-based metrics into a piece of art that shows the path of each flight in action. A glorious example of numerical metrics transformed into something accessible, engaging, and informational for everyone.
We’ve created a metric with our data scientists called P0, the progress to zero, and we talk in terms of the progress to zero in terms of case counts and deaths. Data has always been important for organizations, but now, faced with so much uncertainty, everybody is interested in having more.
One client proudly showed me this evaluation dashboard: The kind of dashboard that foreshadows failure This is the tools trapthe belief that adopting the right tools or frameworks (in this case, generic metrics) will solve your AI problems. Second, too many metrics fragment your attention. When everything is important, nothing is.
We organize all of the trending information in your field so you don't have to. Join 42,000+ users and stay up to date on the latest articles your peers are reading.
You know about us, now we want to get to know you!
Let's personalize your content
Let's get even more personalized
We recognize your account from another site in our network, please click 'Send Email' below to continue with verifying your account and setting a password.


Let's personalize your content